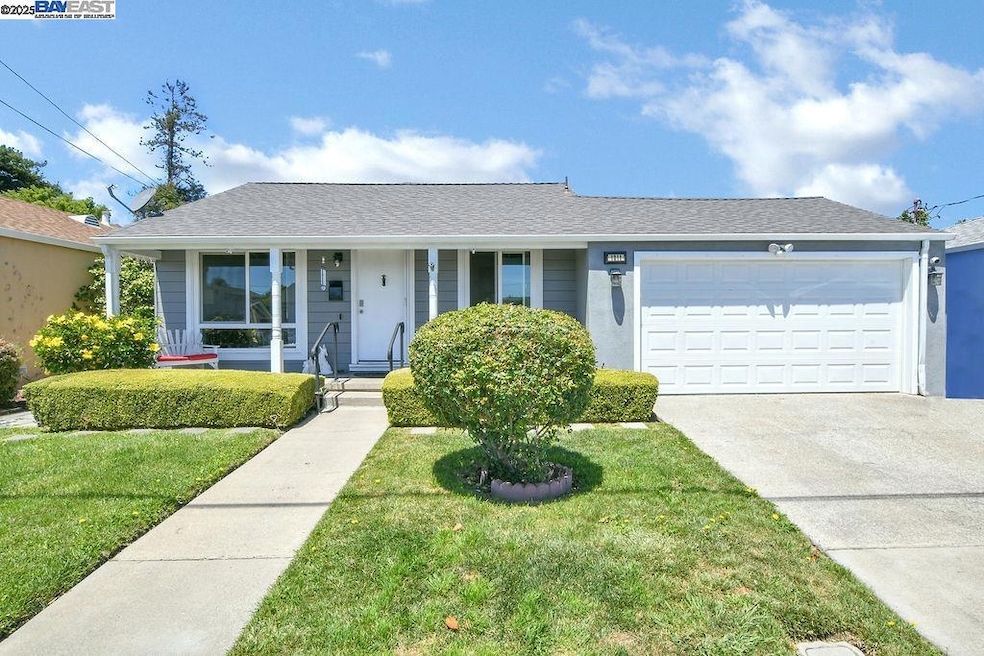


1311 Via Manzanas San Lorenzo, CA 94580
Estimated payment $4,641/month
Highlights
- Updated Kitchen
- No HOA
- Double Pane Windows
- Contemporary Architecture
- 2 Car Attached Garage
- 5-minute walk to Del Rey Park
About This Home
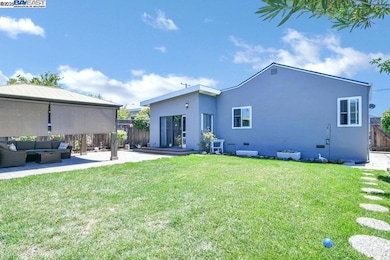
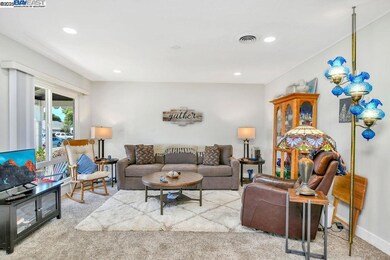
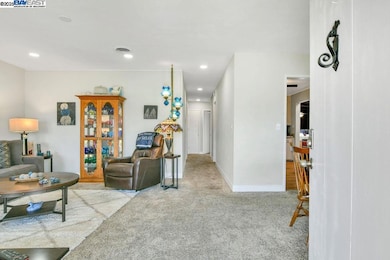
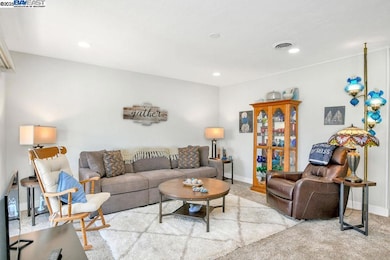
REDUCED PRICE!! SAN LORENZO VILLAGE - NO HOA! Well maintained and updated throughout - 1484 sq ft 3/1 with 2 car garage - Open concept living w/Formal living & dining room plus spacious family room w/new gas stove - Kitchen w/new granite counters & kitchen sink & faucet, NEW SS appliances & refrigerator plus casual dining area - Complete bath remodel - new luxury laminate flooring - New Interior / Exterior paint - New dual pane windows - New roof asphalt shingles - Replaced skylights in bath & dining room - Structure of garage rafter and header replaced - New garage door - New phantom screen door front & front door code lock - Entertainers backyard w/new fences & gates (back & right side) - 12x16 wood gazebo w/shades & set up with TV - 1000 ft new patio pavers - New 10x12 Tuff Shed - Moen water leak detector installed - New ceiling fans & vertical blinds - All this and more...
Home Details
Home Type
- Single Family
Est. Annual Taxes
- $1,909
Year Built
- Built in 1951
Lot Details
- 5,500 Sq Ft Lot
Parking
- 2 Car Attached Garage
- Garage Door Opener
Home Design
- Contemporary Architecture
- Stucco
Interior Spaces
- 1-Story Property
- Double Pane Windows
- Family Room with Fireplace
- Washer and Dryer Hookup
Kitchen
- Updated Kitchen
- Gas Range
- Dishwasher
Flooring
- Carpet
- Laminate
Bedrooms and Bathrooms
- 3 Bedrooms
- 1 Full Bathroom
Utilities
- Forced Air Heating and Cooling System
- Well
Community Details
- No Home Owners Association
- San Lorenzo Vilg Subdivision
Listing and Financial Details
- Assessor Parcel Number 4116085
Map
Home Values in the Area
Average Home Value in this Area
Tax History
| Year | Tax Paid | Tax Assessment Tax Assessment Total Assessment is a certain percentage of the fair market value that is determined by local assessors to be the total taxable value of land and additions on the property. | Land | Improvement |
|---|---|---|---|---|
| 2025 | $1,909 | $95,590 | $35,057 | $67,533 |
| 2024 | $1,909 | $93,580 | $34,370 | $66,210 |
| 2023 | $1,919 | $98,608 | $33,696 | $64,912 |
| 2022 | $1,870 | $89,675 | $33,036 | $63,639 |
| 2021 | $1,808 | $87,779 | $32,388 | $62,391 |
| 2020 | $1,753 | $93,808 | $32,056 | $61,752 |
| 2019 | $1,734 | $91,969 | $31,428 | $60,541 |
| 2018 | $1,570 | $90,165 | $30,811 | $59,354 |
| 2017 | $1,503 | $88,398 | $30,207 | $58,191 |
| 2016 | $1,429 | $86,665 | $29,615 | $57,050 |
| 2015 | $1,393 | $85,363 | $29,170 | $56,193 |
| 2014 | $1,372 | $83,691 | $28,599 | $55,092 |
Property History
| Date | Event | Price | List to Sale | Price per Sq Ft |
|---|---|---|---|---|
| 11/15/2025 11/15/25 | Pending | -- | -- | -- |
| 11/11/2025 11/11/25 | Price Changed | $848,800 | -2.3% | $572 / Sq Ft |
| 11/03/2025 11/03/25 | Price Changed | $868,800 | -1.3% | $585 / Sq Ft |
| 10/26/2025 10/26/25 | For Sale | $879,800 | -- | $593 / Sq Ft |
Purchase History
| Date | Type | Sale Price | Title Company |
|---|---|---|---|
| Grant Deed | -- | None Listed On Document | |
| Deed | -- | None Listed On Document | |
| Interfamily Deed Transfer | -- | None Available |
Source: Bay East Association of REALTORS®
MLS Number: 41115871
APN: 411-0060-085-00
Disclaimer: Certain information contained herein is derived from information provided by parties other than Homes.com. All information provided is deemed reliable, but is not guaranteed to be accurate and should be independently verified.
![]() Bay East ©2025. CCAR ©2025. bridgeMLS ©2025. Information Deemed Reliable But Not Guaranteed. This information is being provided by the Bay East MLS, or CCAR MLS, or bridgeMLS. The listings presented here may or may not be listed by the Broker/Agent operating this website. This information is intended for the personal use of consumers and may not be used for any purpose other than to identify prospective properties consumers may be interested in purchasing.
Bay East ©2025. CCAR ©2025. bridgeMLS ©2025. Information Deemed Reliable But Not Guaranteed. This information is being provided by the Bay East MLS, or CCAR MLS, or bridgeMLS. The listings presented here may or may not be listed by the Broker/Agent operating this website. This information is intended for the personal use of consumers and may not be used for any purpose other than to identify prospective properties consumers may be interested in purchasing.
- 1266 Via el Monte
- 17137 Via Alamitos
- 1575 Via Lucas
- 17221 Via Estrella
- 1401 Via Coralla
- 1699 Bandoni Ave
- 16011 Via Conejo
- 0 E 14th St Unit 41059501
- 1086 Via Coralla
- 1631 Via Ventana
- 15822 Devonwood Way
- 1088 Azalea Ct
- 18005 Sunol Rd
- 1649 Via Tovita
- 18003 Incline Place
- 15881 Paseo Largavista
- 18018 Sahara Rd
- 1786 Via Chorro
- 15867 Hesperian Blvd
- 15596 Tilden St
