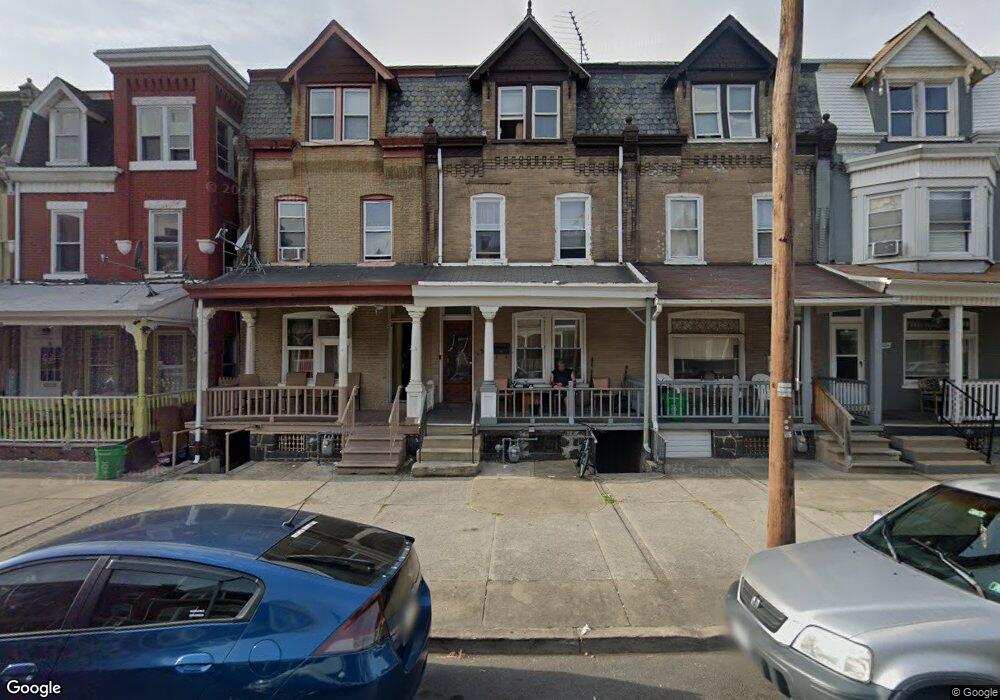
1311 W Chew St Allentown, PA 18102
Center City NeighborhoodEstimated Value: $197,546 - $250,000
5
Beds
1
Bath
1,864
Sq Ft
$123/Sq Ft
Est. Value
About This Home
This home is located at 1311 W Chew St, Allentown, PA 18102 and is currently estimated at $229,637, approximately $123 per square foot. 1311 W Chew St is a home located in Lehigh County with nearby schools including Huntington Elementary School, Luis A. Ramos Elementary School, and San Rafael Junior High School.
Ownership History
Date
Name
Owned For
Owner Type
Purchase Details
Closed on
Apr 24, 2018
Sold by
Hahalis Niki and Hahalis Alexander N
Bought by
Neva Rental Property One Llc
Current Estimated Value
Home Financials for this Owner
Home Financials are based on the most recent Mortgage that was taken out on this home.
Original Mortgage
$290,000
Outstanding Balance
$249,395
Interest Rate
4.44%
Mortgage Type
New Conventional
Estimated Equity
-$19,758
Purchase Details
Closed on
May 26, 2005
Sold by
Martinez Elizabeth
Bought by
Hahalis Alexander N and Hahalis Niki
Home Financials for this Owner
Home Financials are based on the most recent Mortgage that was taken out on this home.
Original Mortgage
$57,400
Interest Rate
5.79%
Mortgage Type
Fannie Mae Freddie Mac
Purchase Details
Closed on
Aug 10, 1998
Sold by
Adams Dianne J and Haas Dianne J
Bought by
Martinez Elizabeth
Purchase Details
Closed on
Aug 23, 1989
Bought by
Adams Dianne J
Purchase Details
Closed on
Jan 5, 1989
Sold by
O'Brien James Gerard
Bought by
Admas Dianne J and Loch Dennis M
Purchase Details
Closed on
Jun 29, 1987
Bought by
O'Brien James Gerard
Create a Home Valuation Report for This Property
The Home Valuation Report is an in-depth analysis detailing your home's value as well as a comparison with similar homes in the area
Home Values in the Area
Average Home Value in this Area
Purchase History
| Date | Buyer | Sale Price | Title Company |
|---|---|---|---|
| Neva Rental Property One Llc | $81,952 | None Available | |
| Hahalis Alexander N | $82,000 | -- | |
| Martinez Elizabeth | $47,000 | -- | |
| Adams Dianne J | $23,800 | -- | |
| Admas Dianne J | $48,000 | -- | |
| O'Brien James Gerard | $48,000 | -- |
Source: Public Records
Mortgage History
| Date | Status | Borrower | Loan Amount |
|---|---|---|---|
| Open | Neva Rental Property One Llc | $290,000 | |
| Previous Owner | Hahalis Alexander N | $57,400 |
Source: Public Records
Tax History Compared to Growth
Tax History
| Year | Tax Paid | Tax Assessment Tax Assessment Total Assessment is a certain percentage of the fair market value that is determined by local assessors to be the total taxable value of land and additions on the property. | Land | Improvement |
|---|---|---|---|---|
| 2025 | $2,555 | $78,800 | $6,400 | $72,400 |
| 2024 | $2,555 | $78,800 | $6,400 | $72,400 |
| 2023 | $2,555 | $78,800 | $6,400 | $72,400 |
| 2022 | $2,465 | $78,800 | $72,400 | $6,400 |
| 2021 | $2,416 | $78,800 | $6,400 | $72,400 |
| 2020 | $2,353 | $78,800 | $6,400 | $72,400 |
| 2019 | $2,315 | $78,800 | $6,400 | $72,400 |
| 2018 | $2,161 | $78,800 | $6,400 | $72,400 |
| 2017 | $2,106 | $78,800 | $6,400 | $72,400 |
| 2016 | -- | $78,800 | $6,400 | $72,400 |
| 2015 | -- | $78,800 | $6,400 | $72,400 |
| 2014 | -- | $78,800 | $6,400 | $72,400 |
Source: Public Records
Map
Nearby Homes
- 217 N 13th St
- 1326 W Turner St
- 1336 W Turner St
- 1416 W Chew St
- 231 N 12th St
- 1141 Emmett St
- 127 N Franklin St
- 42 N 13th St
- 329 N 15th St
- 36 N Jefferson St
- 35 N Jefferson St
- 24 N 13th St
- 1420 W Linden St
- 1357 W Liberty St
- 131 N Poplar St
- 112 N Poplar St
- 140 N 11th St
- 21 N Jefferson St
- 1429 W Liberty St
- 1035 W Turner St
- 1313 W Chew St
- 1309 W Chew St
- 1315.5 Chew
- 1315 W Chew St
- 1305 W Chew St
- 1317 W Chew St
- 1303 W Chew St
- 1319 W Chew St
- 1319 W Chew St
- 1301 W Chew St
- 1321 W Chew St
- 314 N 13th St
- 1323 W Chew St
- 1312 W Chew St
- 1308 W Chew St
- 1316 W Chew St
- 1308-1/2 W Chew St
- 1325 W Chew St
- 1320 W Chew St Unit 2
- 318 N 13th St