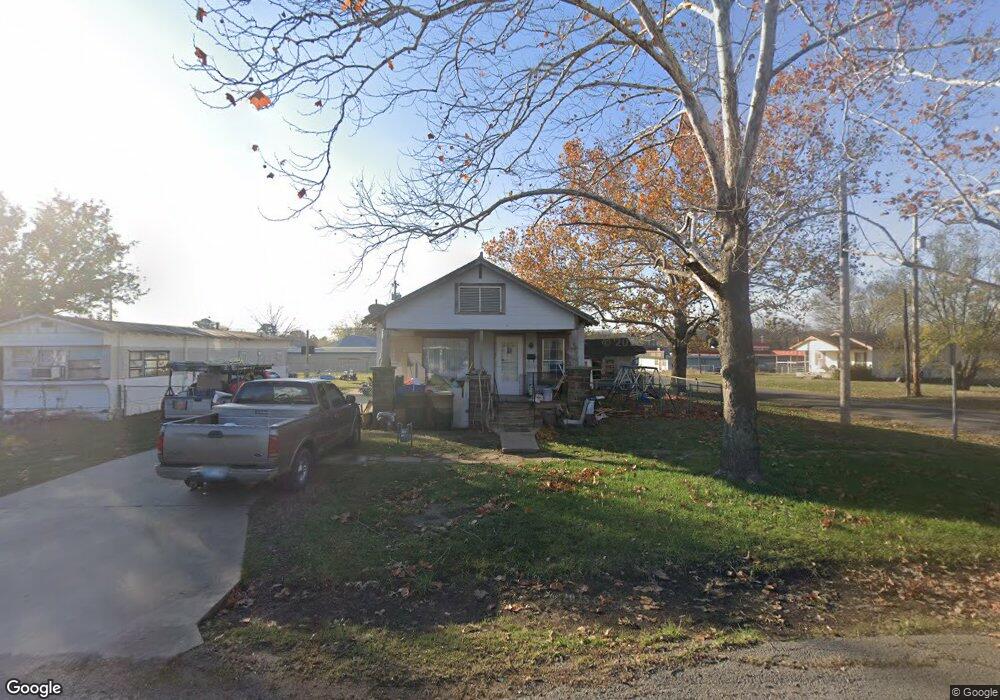
1311 W Trudgeon St Henryetta, OK 74437
Estimated Value: $49,869 - $108,000
2
Beds
1
Bath
1,100
Sq Ft
$72/Sq Ft
Est. Value
About This Home
This home is located at 1311 W Trudgeon St, Henryetta, OK 74437 and is currently estimated at $79,217, approximately $72 per square foot. 1311 W Trudgeon St is a home located in Okmulgee County with nearby schools including Henryetta Elementary School, Henryetta Middle School, and Henryetta High School.
Ownership History
Date
Name
Owned For
Owner Type
Purchase Details
Closed on
Mar 16, 2023
Sold by
Chastain Freddie
Bought by
Treat Darrin and Treat Ashley
Current Estimated Value
Purchase Details
Closed on
Aug 6, 2020
Sold by
Chastain Freddie R
Bought by
Treat Darrin R and Treat Ashley N
Home Financials for this Owner
Home Financials are based on the most recent Mortgage that was taken out on this home.
Original Mortgage
$15,000
Interest Rate
3.1%
Mortgage Type
Land Contract Argmt. Of Sale
Purchase Details
Closed on
Jan 7, 2011
Sold by
Greenough Charles
Bought by
Chastain Freddie R
Purchase Details
Closed on
Jan 6, 2011
Sold by
Sweet Rentals Llc
Bought by
Chastain Freddie R
Purchase Details
Closed on
Feb 18, 2009
Sold by
Sweet Frank L and Sweet Frank Leon
Bought by
Sweet Rentals Llc
Purchase Details
Closed on
Jul 28, 2000
Sold by
Gragg Rodger A
Bought by
Sweet Frank L and Sweet Treila
Create a Home Valuation Report for This Property
The Home Valuation Report is an in-depth analysis detailing your home's value as well as a comparison with similar homes in the area
Home Values in the Area
Average Home Value in this Area
Purchase History
| Date | Buyer | Sale Price | Title Company |
|---|---|---|---|
| Treat Darrin | $15,000 | None Listed On Document | |
| Treat Darrin R | $15,000 | None Available | |
| Chastain Freddie R | $32,000 | None Available | |
| Chastain Freddie R | -- | None Available | |
| Sweet Rentals Llc | -- | None Available | |
| Sweet Frank L | $23,000 | -- |
Source: Public Records
Mortgage History
| Date | Status | Borrower | Loan Amount |
|---|---|---|---|
| Previous Owner | Treat Darrin R | $15,000 |
Source: Public Records
Tax History Compared to Growth
Tax History
| Year | Tax Paid | Tax Assessment Tax Assessment Total Assessment is a certain percentage of the fair market value that is determined by local assessors to be the total taxable value of land and additions on the property. | Land | Improvement |
|---|---|---|---|---|
| 2025 | $92 | $1,854 | $127 | $1,727 |
| 2024 | $181 | $1,800 | $124 | $1,676 |
| 2023 | $340 | $3,493 | $240 | $3,253 |
| 2022 | $388 | $3,964 | $240 | $3,724 |
| 2021 | $393 | $3,964 | $240 | $3,724 |
| 2020 | $394 | $3,970 | $240 | $3,730 |
| 2019 | $390 | $3,976 | $240 | $3,736 |
| 2018 | $390 | $3,960 | $240 | $3,720 |
| 2017 | $372 | $3,771 | $240 | $3,531 |
| 2016 | $354 | $3,592 | $240 | $3,352 |
| 2015 | $305 | $3,862 | $240 | $3,622 |
| 2014 | $324 | $4,033 | $229 | $3,804 |
Source: Public Records
Map
Nearby Homes
- 1403 W Division St
- 911 W Trudgeon St
- 805 W Gentry St
- 810 W Gentry St
- 611 W Gentry St
- 906 N 14th St
- 602 W Cummings St
- 709 W Corporation St
- 104500 S 4095 Rd
- 502 W Merrick St
- 512 N 4th St
- 310 W Corporation
- 0 W Corporation St Unit 2535865
- 1205 N 8th St
- 112 W Merrick St
- 101 E Corporation St
- 201 E Main St
- 304 W Barclay St
- 612 NE 1st St
- 1103 Oakwood Cir
- 1307 W Trudgeon St
- 1305 W Trudgeon St
- 107 N 14th St
- 1312 W Trudgeon St
- 1301 W Trudgeon St
- 107 N 13th St
- 1308 W Trudgeon St
- 1402 W Main St
- 201 N 14th St
- 1302 W Trudgeon St
- 1403 W Trudgeon St
- 1406 W Trudgeon St
- 1405 W Trudgeon St
- 1311 W Main St
- 1211 W Trudgeon St
- 108 N 13th St
- 1305 W Division St
- 106 N 13th St
- 1303 W Main St
- 1407 W Trudgeon St