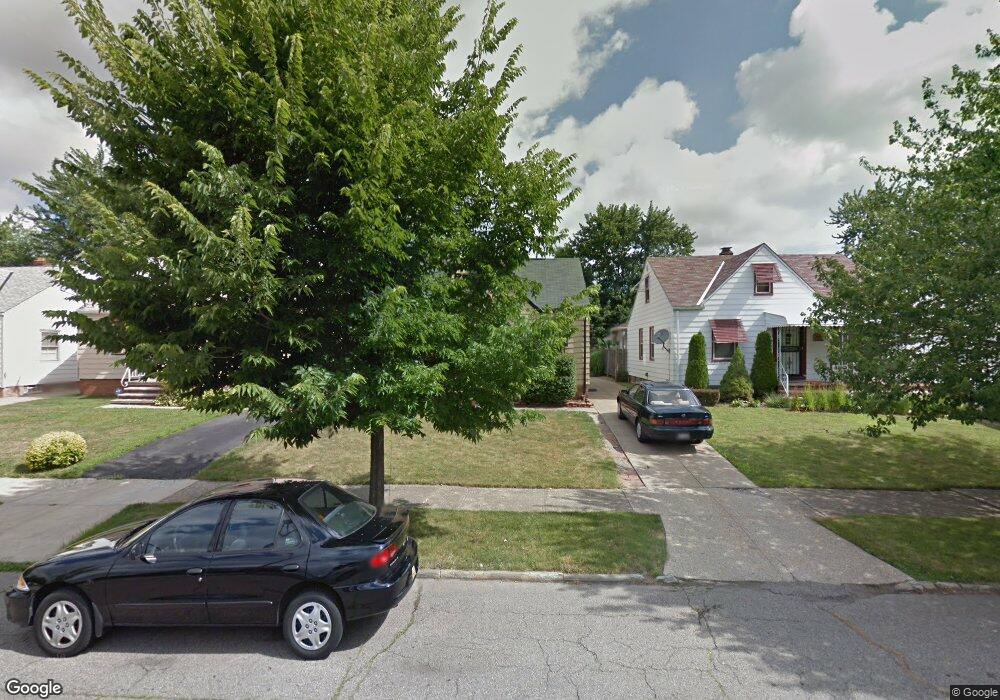
13116 Saint James Ave Cleveland, OH 44135
Bellaire-Puritas NeighborhoodEstimated Value: $66,000 - $146,000
3
Beds
2
Baths
1,221
Sq Ft
$82/Sq Ft
Est. Value
About This Home
This home is located at 13116 Saint James Ave, Cleveland, OH 44135 and is currently estimated at $99,888, approximately $81 per square foot. 13116 Saint James Ave is a home located in Cuyahoga County with nearby schools including Artemus Ward School, Almira Academy, and Benjamin Franklin.
Ownership History
Date
Name
Owned For
Owner Type
Purchase Details
Closed on
Aug 25, 2025
Sold by
Shipp Gerald and Shipp Garilyn A
Bought by
Shipp Gerald A
Current Estimated Value
Home Financials for this Owner
Home Financials are based on the most recent Mortgage that was taken out on this home.
Original Mortgage
$57,170
Outstanding Balance
$57,170
Interest Rate
6.72%
Mortgage Type
FHA
Estimated Equity
$42,718
Purchase Details
Closed on
Dec 31, 1998
Sold by
Kuhns Paul B
Bought by
Shipp Gerald and Shipp Garilyn A
Home Financials for this Owner
Home Financials are based on the most recent Mortgage that was taken out on this home.
Original Mortgage
$63,967
Interest Rate
6.83%
Mortgage Type
FHA
Purchase Details
Closed on
Oct 23, 1987
Sold by
Walters Thomas G and Walters Irene D
Bought by
Kuhns Paul B
Purchase Details
Closed on
Jul 9, 1984
Sold by
Walters Thomas G and Walters Irene D
Bought by
Walters Thomas G and Walters Irene D
Purchase Details
Closed on
Jan 1, 1975
Bought by
Walters Thomas G and Walters Irene D
Create a Home Valuation Report for This Property
The Home Valuation Report is an in-depth analysis detailing your home's value as well as a comparison with similar homes in the area
Home Values in the Area
Average Home Value in this Area
Purchase History
| Date | Buyer | Sale Price | Title Company |
|---|---|---|---|
| Shipp Gerald A | $66,103 | Stewart Title | |
| Shipp Gerald | $64,000 | Guardian Title | |
| Kuhns Paul B | $40,000 | -- | |
| Walters Thomas G | -- | -- | |
| Walters Thomas G | -- | -- |
Source: Public Records
Mortgage History
| Date | Status | Borrower | Loan Amount |
|---|---|---|---|
| Open | Shipp Gerald A | $57,170 | |
| Previous Owner | Shipp Gerald | $63,967 |
Source: Public Records
Tax History Compared to Growth
Tax History
| Year | Tax Paid | Tax Assessment Tax Assessment Total Assessment is a certain percentage of the fair market value that is determined by local assessors to be the total taxable value of land and additions on the property. | Land | Improvement |
|---|---|---|---|---|
| 2024 | $2,432 | $37,100 | $7,700 | $29,400 |
| 2023 | $2,031 | $26,780 | $5,710 | $21,070 |
| 2022 | $2,020 | $26,775 | $5,705 | $21,070 |
| 2021 | $1,999 | $26,780 | $5,710 | $21,070 |
| 2020 | $1,793 | $20,760 | $4,410 | $16,350 |
| 2019 | $1,658 | $59,300 | $12,600 | $46,700 |
| 2018 | $1,622 | $20,760 | $4,410 | $16,350 |
| 2017 | $1,606 | $19,470 | $3,540 | $15,930 |
| 2016 | $1,593 | $19,470 | $3,540 | $15,930 |
| 2015 | $1,682 | $19,470 | $3,540 | $15,930 |
| 2014 | $1,682 | $20,480 | $3,710 | $16,770 |
Source: Public Records
Map
Nearby Homes
- 13313 Highlandview Ave
- 13209 Liberty Ave
- 13402 Saint James Ave
- 13206 Liberty Ave
- 4329 W 131st St
- 4059 W 130th St
- 12620 Grimsby Ave
- 4349 W 132nd St
- 4162 Victory Blvd
- 12508 Sobieski Ave
- 12510 Grimsby Ave
- 13410 Gilmore Ave
- 13301 Courtland Ave
- 13904 Highlandview Ave
- 12312 Guardian Blvd
- 4322 W 138th St
- 3958 W 130th St
- 3918 Brookside Blvd
- 13810 Clifford Ave
- 13401 Puritas Ave
- 13112 Saint James Ave
- 13120 Saint James Ave
- 13108 Saint James Ave
- 13200 Saint James Ave
- 13104 Saint James Ave
- 13121 Highlandview Ave
- 13117 Highlandview Ave
- 13201 Highlandview Ave
- 13113 Highlandview Ave
- 13205 Highlandview Ave
- 13100 Saint James Ave
- 13208 Saint James Ave
- 13109 Highlandview Ave
- 13209 Highlandview Ave
- 13113 Saint James Ave
- 13121 Saint James Ave
- 13113 St James
- 13201 Saint James Ave
- 13109 Saint James Ave
- 13105 Highlandview Ave