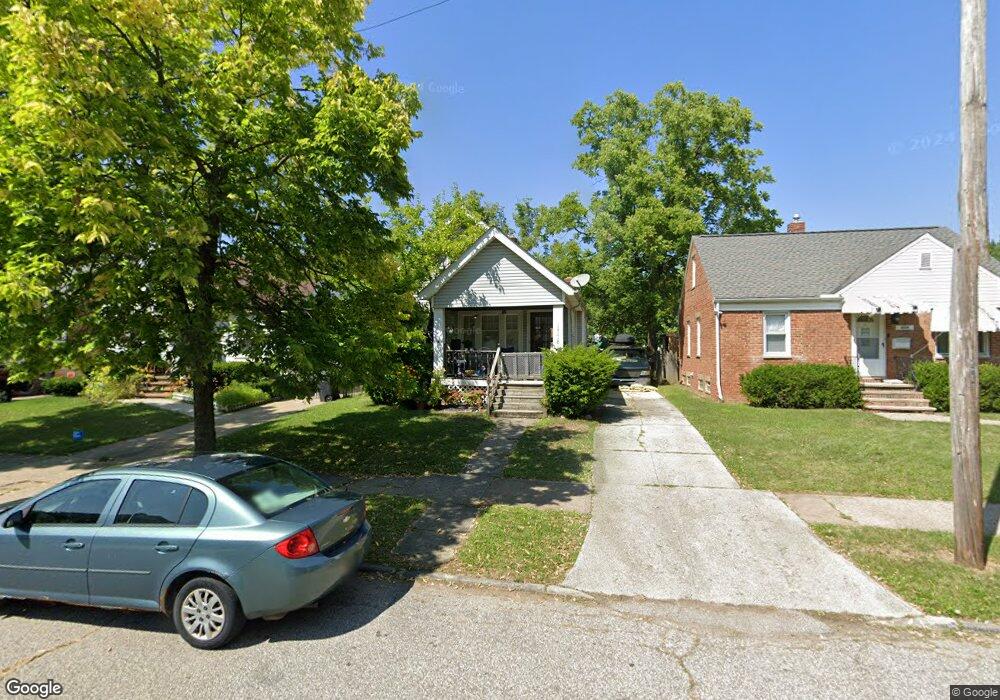
13118 Highlandview Ave Cleveland, OH 44135
Bellaire-Puritas NeighborhoodEstimated Value: $122,958 - $161,000
3
Beds
1
Bath
1,470
Sq Ft
$97/Sq Ft
Est. Value
About This Home
This home is located at 13118 Highlandview Ave, Cleveland, OH 44135 and is currently estimated at $142,990, approximately $97 per square foot. 13118 Highlandview Ave is a home located in Cuyahoga County with nearby schools including Artemus Ward School, Almira Academy, and Benjamin Franklin.
Ownership History
Date
Name
Owned For
Owner Type
Purchase Details
Closed on
Jun 22, 2020
Sold by
Mach Tom and Mach Lisa A
Bought by
Mach Tom and Mach Lisa A
Current Estimated Value
Purchase Details
Closed on
Nov 13, 2009
Sold by
Mach Lisa A and Mach Kim V
Bought by
Mach Lisa A and Mach Tom
Home Financials for this Owner
Home Financials are based on the most recent Mortgage that was taken out on this home.
Original Mortgage
$50,162
Outstanding Balance
$32,938
Interest Rate
5.11%
Mortgage Type
FHA
Estimated Equity
$110,052
Purchase Details
Closed on
Dec 19, 1994
Sold by
Grant Clyde L
Bought by
Botic Lisa A and Botic Kim V
Home Financials for this Owner
Home Financials are based on the most recent Mortgage that was taken out on this home.
Original Mortgage
$54,300
Interest Rate
9.06%
Mortgage Type
FHA
Purchase Details
Closed on
Sep 9, 1993
Sold by
Grant Clyde L
Bought by
Grant Clyde L
Purchase Details
Closed on
Mar 22, 1993
Sold by
Kerber Ronald and Kerber Rita
Bought by
Grant Clyde L
Purchase Details
Closed on
Jan 1, 1975
Bought by
Kerber Ronald and Kerber Rita
Create a Home Valuation Report for This Property
The Home Valuation Report is an in-depth analysis detailing your home's value as well as a comparison with similar homes in the area
Home Values in the Area
Average Home Value in this Area
Purchase History
| Date | Buyer | Sale Price | Title Company |
|---|---|---|---|
| Mach Tom | -- | None Available | |
| Mach Lisa A | -- | Attorney | |
| Botic Lisa A | $54,400 | -- | |
| Grant Clyde L | -- | -- | |
| Grant Clyde L | $48,000 | -- | |
| Kerber Ronald | -- | -- |
Source: Public Records
Mortgage History
| Date | Status | Borrower | Loan Amount |
|---|---|---|---|
| Open | Mach Lisa A | $50,162 | |
| Closed | Botic Lisa A | $54,300 |
Source: Public Records
Tax History Compared to Growth
Tax History
| Year | Tax Paid | Tax Assessment Tax Assessment Total Assessment is a certain percentage of the fair market value that is determined by local assessors to be the total taxable value of land and additions on the property. | Land | Improvement |
|---|---|---|---|---|
| 2024 | $2,715 | $41,405 | $7,700 | $33,705 |
| 2023 | $2,201 | $29,020 | $5,710 | $23,310 |
| 2022 | $2,189 | $29,020 | $5,710 | $23,310 |
| 2021 | $2,167 | $29,020 | $5,710 | $23,310 |
| 2020 | $1,940 | $22,470 | $4,410 | $18,060 |
| 2019 | $1,794 | $64,200 | $12,600 | $51,600 |
| 2018 | $1,788 | $22,470 | $4,410 | $18,060 |
| 2017 | $1,729 | $20,970 | $3,540 | $17,430 |
| 2016 | $1,716 | $20,970 | $3,540 | $17,430 |
| 2015 | $1,811 | $20,970 | $3,540 | $17,430 |
| 2014 | $1,811 | $22,050 | $3,710 | $18,340 |
Source: Public Records
Map
Nearby Homes
- 13209 Liberty Ave
- 13313 Highlandview Ave
- 13206 Liberty Ave
- 13402 Saint James Ave
- 4059 W 130th St
- 4162 Victory Blvd
- 13301 Courtland Ave
- 4329 W 131st St
- 12620 Grimsby Ave
- 4349 W 132nd St
- 12508 Sobieski Ave
- 13904 Highlandview Ave
- 12510 Grimsby Ave
- 13410 Gilmore Ave
- 3958 W 130th St
- 3918 Brookside Blvd
- 13810 Clifford Ave
- 12312 Guardian Blvd
- 13514 Tyler Ave
- 4322 W 138th St
- 13114 Highlandview Ave
- 13122 Highlandview Ave
- 13110 Highlandview Ave
- 13202 Highlandview Ave
- 13206 Highlandview Ave
- 13106 Highlandview Ave
- 13117 Liberty Ave
- 13121 Liberty Ave
- 13201 Liberty Ave
- 13109 Liberty Ave
- 13210 Highlandview Ave
- 13102 Highlandview Ave
- 13105 Liberty Ave
- 13205 Liberty Ave
- 13117 Highlandview Ave
- 13121 Highlandview Ave
- 13113 Highlandview Ave
- 13201 Highlandview Ave
- 13109 Highlandview Ave
- 13214 Highlandview Ave