Estimated Value: $1,000,000 - $1,200,000
4
Beds
3
Baths
2,767
Sq Ft
$396/Sq Ft
Est. Value
About This Home
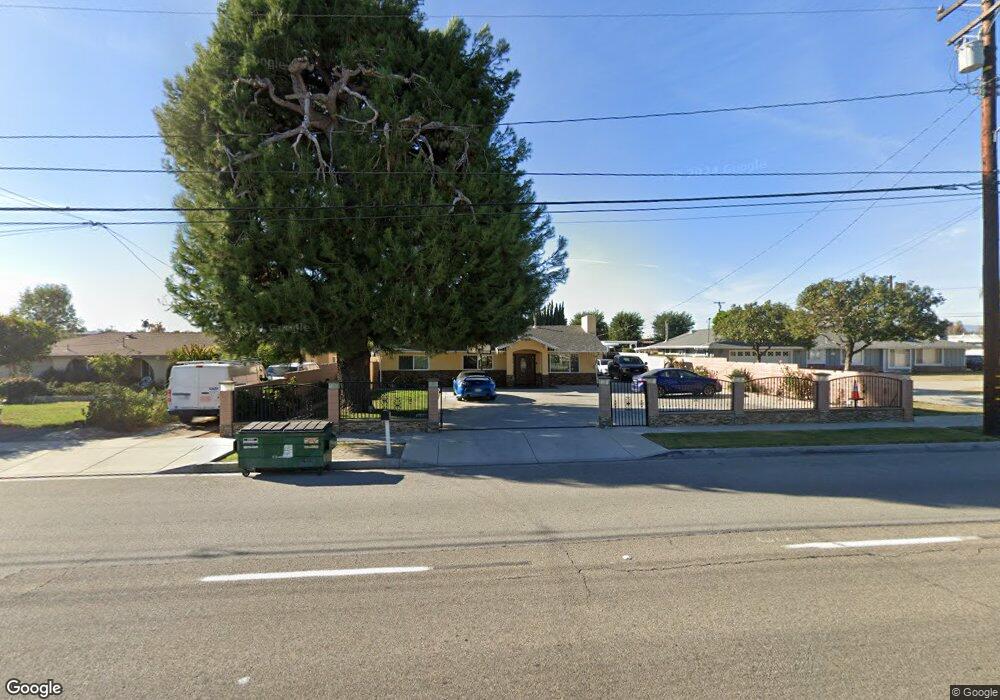
This home is located at 13118 Pipeline Ave, Chino, CA 91710 and is currently estimated at $1,096,006, approximately $396 per square foot. 13118 Pipeline Ave is a home located in San Bernardino County with nearby schools including Dickson Elementary, Ramona Junior High School, and Don Antonio Lugo High School.
Ownership History
Date
Name
Owned For
Owner Type
Purchase Details
Closed on
Mar 2, 2020
Sold by
Monterroso Rosa Lopez and Martinez Cendy
Bought by
Monterroso Rosa Lopez
Current Estimated Value
Home Financials for this Owner
Home Financials are based on the most recent Mortgage that was taken out on this home.
Original Mortgage
$280,000
Outstanding Balance
$248,448
Interest Rate
3.6%
Mortgage Type
New Conventional
Estimated Equity
$847,558
Purchase Details
Closed on
May 13, 2011
Sold by
Castillo Patrick M
Bought by
Salarda Mirelle F
Home Financials for this Owner
Home Financials are based on the most recent Mortgage that was taken out on this home.
Original Mortgage
$414,226
Interest Rate
3.75%
Mortgage Type
FHA
Purchase Details
Closed on
Mar 22, 2011
Sold by
Garrison Teresa L L
Bought by
Monterroso Rosa Lopez and Martinez Cendy
Home Financials for this Owner
Home Financials are based on the most recent Mortgage that was taken out on this home.
Original Mortgage
$414,226
Interest Rate
3.75%
Mortgage Type
FHA
Create a Home Valuation Report for This Property
The Home Valuation Report is an in-depth analysis detailing your home's value as well as a comparison with similar homes in the area
Home Values in the Area
Average Home Value in this Area
Purchase History
| Date | Buyer | Sale Price | Title Company |
|---|---|---|---|
| Monterroso Rosa Lopez | -- | First American Title Company | |
| Salarda Mirelle F | -- | Orange Coast Title Company | |
| Monterroso Rosa Lopez | $425,000 | Orange Coast Title Company |
Source: Public Records
Mortgage History
| Date | Status | Borrower | Loan Amount |
|---|---|---|---|
| Open | Monterroso Rosa Lopez | $280,000 | |
| Previous Owner | Monterroso Rosa Lopez | $414,226 |
Source: Public Records
Tax History Compared to Growth
Tax History
| Year | Tax Paid | Tax Assessment Tax Assessment Total Assessment is a certain percentage of the fair market value that is determined by local assessors to be the total taxable value of land and additions on the property. | Land | Improvement |
|---|---|---|---|---|
| 2025 | $7,544 | $695,515 | $238,417 | $457,098 |
| 2024 | $7,544 | $681,877 | $233,742 | $448,135 |
| 2023 | $7,335 | $668,507 | $229,159 | $439,348 |
| 2022 | $7,292 | $655,399 | $224,666 | $430,733 |
| 2021 | $7,150 | $642,548 | $220,261 | $422,287 |
| 2020 | $5,532 | $497,875 | $164,006 | $333,869 |
| 2019 | $5,436 | $488,113 | $160,790 | $327,323 |
| 2018 | $5,316 | $478,542 | $157,637 | $320,905 |
| 2017 | $5,221 | $469,159 | $154,546 | $314,613 |
| 2016 | $4,879 | $459,960 | $151,516 | $308,444 |
| 2015 | $4,781 | $453,051 | $149,240 | $303,811 |
| 2014 | $4,681 | $444,177 | $146,317 | $297,860 |
Source: Public Records
Map
Nearby Homes
- 13232 Yorkers Place Unit C
- 12958 Boston Ave
- 4449 Carmen St
- 3778 Pilgrims Way
- 0 Pilgrims Way
- 4524 Carmen St
- 4539 Carmen St
- 13139 Derby Ave
- 13401 Wisteria Place
- 3557 Riverside Dr
- 3516 Larkwood Dr
- 4099 Walnut Ave
- 4621 Chino Ave
- 13640 Norton Ave
- 3947 Jose Ct
- 12540 Ramona Ave
- 4814 Ranch Rd
- 3709 Kern Rd
- 12951 Royal Palm Cir
- 13798 Roswell Ave
- 13134 Pipeline Ave
- 13108 Pipeline Ave
- 13144 Pipeline Ave
- 13156 Pipeline Ave
- 4015 Biscayne St
- 13133 Pipeline Ave
- 13111 Pipeline Ave
- 4041 Biscayne St
- 13151 Pipeline Ave
- 13085 Pipeline Ave
- 4114 Denali Ln
- 4061 Biscayne St
- 13180 Pipeline Ave
- 4016 Biscayne St
- 13192 Pipeline Ave
- 4040 Biscayne St
- 4117 Biscayne St
- 4138 Denali Ln
- 13177 Pipeline Ave
- 4129 Biscayne St