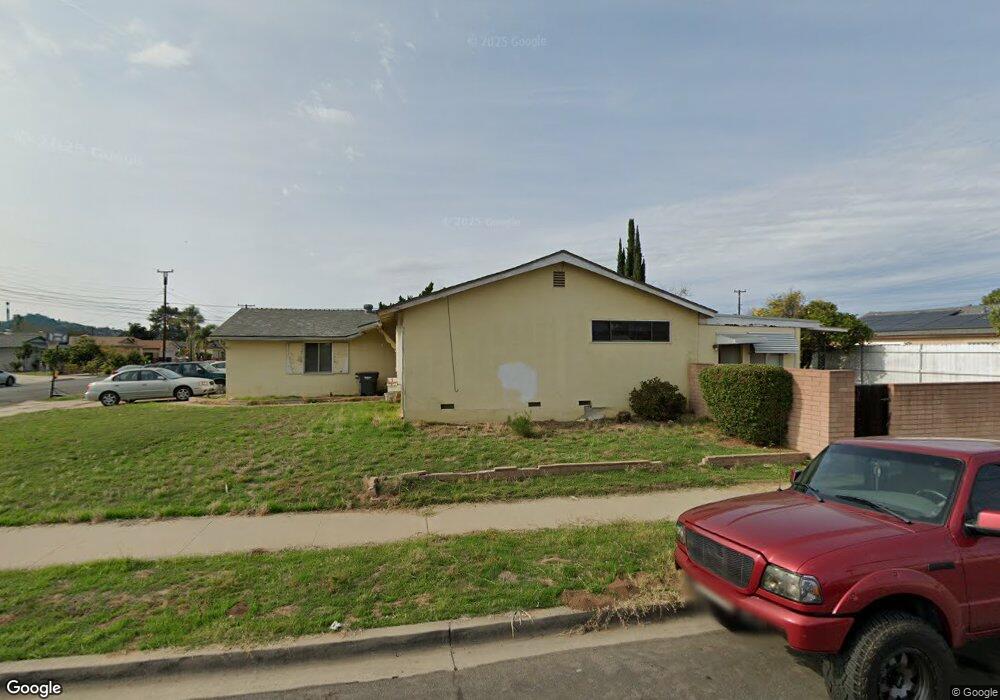
1312 Exeter St El Cajon, CA 92019
Estimated Value: $782,000 - $842,000
3
Beds
2
Baths
1,728
Sq Ft
$469/Sq Ft
Est. Value
About This Home
This home is located at 1312 Exeter St, El Cajon, CA 92019 and is currently estimated at $810,222, approximately $468 per square foot. 1312 Exeter St is a home located in San Diego County with nearby schools including Meridian Elementary School, Montgomery Middle School, and El Cajon Valley High School.
Ownership History
Date
Name
Owned For
Owner Type
Purchase Details
Closed on
Dec 5, 2014
Sold by
Goshen Charles E and Goshen Adrienne
Bought by
Goshen Charles E and Goshen Adrienne
Current Estimated Value
Purchase Details
Closed on
Mar 13, 1998
Sold by
Jones Joseph B and Jones Christianna L
Bought by
Goshen C Edward and Goshen Adrienne
Home Financials for this Owner
Home Financials are based on the most recent Mortgage that was taken out on this home.
Original Mortgage
$145,037
Outstanding Balance
$26,627
Interest Rate
7.06%
Mortgage Type
VA
Estimated Equity
$783,595
Purchase Details
Closed on
Feb 29, 1996
Sold by
Lambach Carl Ernest and Lambach Glenda Jean
Bought by
Jones Joseph B and Jones Christianna L
Home Financials for this Owner
Home Financials are based on the most recent Mortgage that was taken out on this home.
Original Mortgage
$163,098
Interest Rate
6.98%
Mortgage Type
VA
Create a Home Valuation Report for This Property
The Home Valuation Report is an in-depth analysis detailing your home's value as well as a comparison with similar homes in the area
Home Values in the Area
Average Home Value in this Area
Purchase History
| Date | Buyer | Sale Price | Title Company |
|---|---|---|---|
| Goshen Charles E | -- | None Available | |
| Goshen C Edward | $163,000 | Chicago Title Co | |
| Jones Joseph B | $160,000 | First American Title Co |
Source: Public Records
Mortgage History
| Date | Status | Borrower | Loan Amount |
|---|---|---|---|
| Open | Goshen C Edward | $145,037 | |
| Previous Owner | Jones Joseph B | $163,098 |
Source: Public Records
Tax History Compared to Growth
Tax History
| Year | Tax Paid | Tax Assessment Tax Assessment Total Assessment is a certain percentage of the fair market value that is determined by local assessors to be the total taxable value of land and additions on the property. | Land | Improvement |
|---|---|---|---|---|
| 2025 | $3,388 | $260,243 | $95,790 | $164,453 |
| 2024 | $3,388 | $255,141 | $93,912 | $161,229 |
| 2023 | $3,347 | $250,139 | $92,071 | $158,068 |
| 2022 | $3,300 | $245,235 | $90,266 | $154,969 |
| 2021 | $3,247 | $240,428 | $88,497 | $151,931 |
| 2020 | $3,200 | $237,964 | $87,590 | $150,374 |
| 2019 | $2,791 | $233,299 | $85,873 | $147,426 |
| 2018 | $2,744 | $228,726 | $84,190 | $144,536 |
| 2017 | $2,707 | $224,242 | $82,540 | $141,702 |
| 2016 | $2,598 | $219,846 | $80,922 | $138,924 |
| 2015 | $2,583 | $216,545 | $79,707 | $136,838 |
| 2014 | $2,532 | $212,304 | $78,146 | $134,158 |
Source: Public Records
Map
Nearby Homes
- 255 S 2nd St Unit 7
- 212 S 2nd St Unit 10
- 212 S 2nd St Unit 54
- 212 S 2nd St
- 212 S 2nd St Unit 60
- 212 S 2nd St Unit 38
- 514 Jamacha Rd Unit 6J
- 514 Jamacha Rd Unit 4
- 1313 E Main St Unit 34
- 1417 Sunnyland Ave
- 1380 E Washington Ave Unit 17
- 1380 E Washington Ave Unit 5W
- 1430 E Lexington Ave Unit 79
- 1465 E Lexington Ave Unit 12E
- 1465 E Lexington Ave Unit 21C
- 244 Shady Ln Unit 5
- 1285 E Washington Ave Unit 29
- 1285 E Washington Ave Unit 20
- 1349 E Main St
- 1165 Decker St Unit 10
- 1308 Exeter St
- 1319 E Lexington Ave Unit ID1283127P
- 1319 E Lexington Ave
- 1315 E Lexington Ave
- 1304 Exeter St
- 309 Alderson St
- E E Lexington
- 339 Alderson St
- 1307 E Lexington Ave
- 1313 Exeter St
- 1309 Exeter St
- 1300 Exeter St
- 367 Alderson St
- 1303 Exeter St
- 1301 E Lexington Ave
- 1298 Exeter St
- 1312 Dunsmuir St
- 1299 Exeter St
- 1308 Dunsmuir St
- 1299 E Lexington Ave