
Landlord's Agent in 2025
Alex Saka
Avenue Realty NJ
(732) 822-5986
3 in this area
124 Total Sales
Estimated Value: $591,000 - $723,000
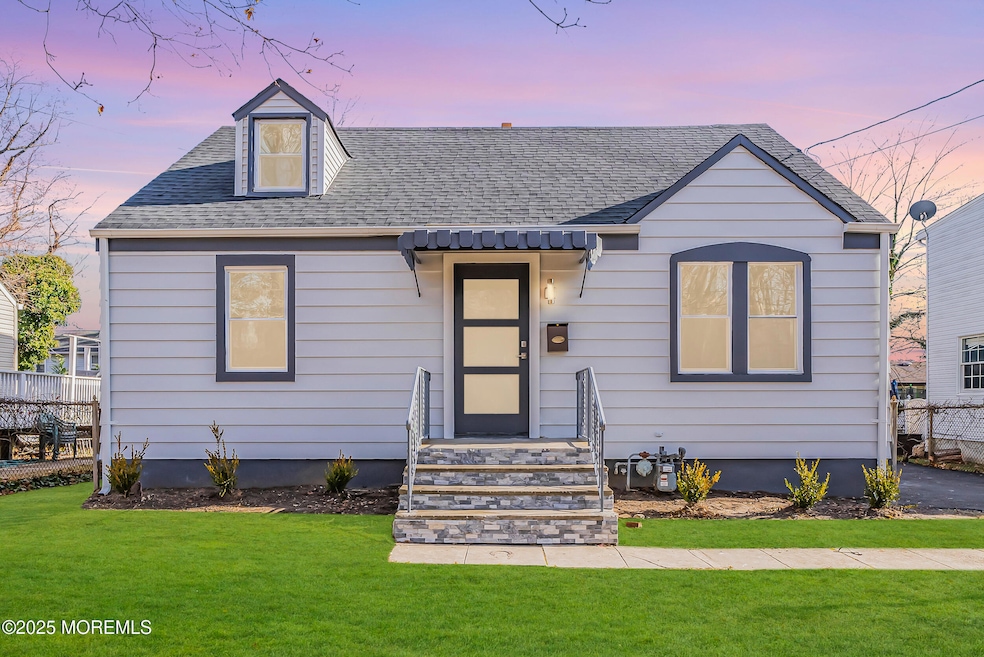
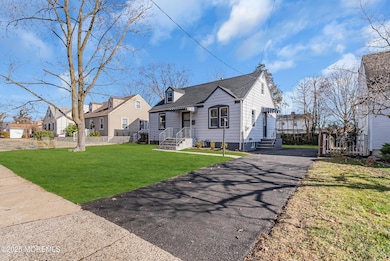
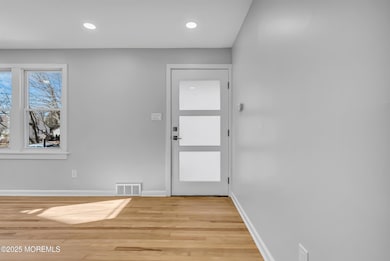
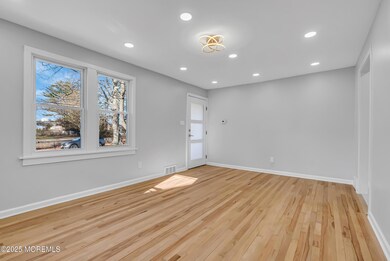
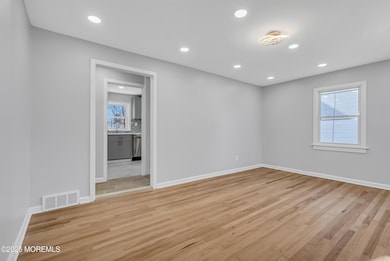
Modern & FULLY RENOVATED 4 Spacious Bedroom / 2 Full designer Bathroom ANNUAL RENTAL home close to chic Asbury, Interlaken, beaches, shopping, restaurants, & public roadways. Renovated home never lived in yet!
Enjoy the comfortable hard wood flooring, white & bright stainless kitchen w/ Quartz bar area, fully finished basement, plenty of closet space, & electric car charger. Make everyday feel like you are living at a 5 star hotel & Call today! Please note: Square footage is approximate and includes finished basement. Brand new Samsung washer/dryer are included in rental! *Grass has been digitally enhanced
| Date | Buyer | Sale Price | Title Company |
|---|---|---|---|
| Logan Holdings Llc | $429,125 | Fidelity National Title | |
| Logan Holdings Llc | $429,125 | Fidelity National Title | |
| O'Brien Donna M | -- | -- |
| Date | Event | Price | List to Sale | Price per Sq Ft | Prior Sale |
|---|---|---|---|---|---|
| 03/11/2025 03/11/25 | Rented | $43,200 | +928.6% | -- | |
| 01/28/2025 01/28/25 | Under Contract | -- | -- | -- | |
| 01/28/2025 01/28/25 | Price Changed | $4,200 | +10.5% | $2 / Sq Ft | |
| 01/12/2025 01/12/25 | For Rent | $3,800 | 0.0% | -- | |
| 09/12/2024 09/12/24 | Sold | $429,125 | -4.6% | $373 / Sq Ft | View Prior Sale |
| 08/01/2024 08/01/24 | Pending | -- | -- | -- | |
| 07/29/2024 07/29/24 | For Sale | $450,000 | -- | $391 / Sq Ft |
| Year | Tax Paid | Tax Assessment Tax Assessment Total Assessment is a certain percentage of the fair market value that is determined by local assessors to be the total taxable value of land and additions on the property. | Land | Improvement |
|---|---|---|---|---|
| 2025 | $6,518 | $471,800 | $363,100 | $108,700 |
| 2024 | $6,443 | $448,600 | $331,700 | $116,900 |
| 2023 | $6,443 | $413,800 | $300,200 | $113,600 |
| 2022 | $5,554 | $336,400 | $228,200 | $108,200 |
| 2021 | $5,554 | $297,700 | $204,500 | $93,200 |
| 2020 | $6,016 | $296,500 | $195,500 | $101,000 |
| 2019 | $5,721 | $275,600 | $175,200 | $100,400 |
| 2018 | $5,684 | $266,500 | $170,700 | $95,800 |
| 2017 | $5,303 | $247,700 | $157,200 | $90,500 |
| 2016 | $5,152 | $216,300 | $130,200 | $86,100 |
| 2015 | $5,031 | $214,000 | $130,200 | $83,800 |
| 2014 | $5,394 | $232,900 | $157,200 | $75,700 |
Landlord's Agent in 2025
Alex Saka
Avenue Realty NJ
(732) 822-5986
3 in this area
124 Total Sales
Seller's Agent in 2024
Frank Camassa
Camassa Agency Inc
(732) 915-8711
1 in this area
65 Total Sales
Source: MOREMLS (Monmouth Ocean Regional REALTORS®)
MLS Number: 22501013
APN: 37-00101-0000-00017
Disclaimer: Certain information contained herein is derived from information provided by parties other than Homes.com. All information provided is deemed reliable, but is not guaranteed to be accurate and should be independently verified.
![]() IDX information is provided exclusively for personal, non-commercial use, and may not be used for any purpose other than to identify prospective properties consumers may be interested in purchasing.
IDX information is provided exclusively for personal, non-commercial use, and may not be used for any purpose other than to identify prospective properties consumers may be interested in purchasing.
Information is deemed reliable but not guaranteed.
Ask me questions while you tour the home.