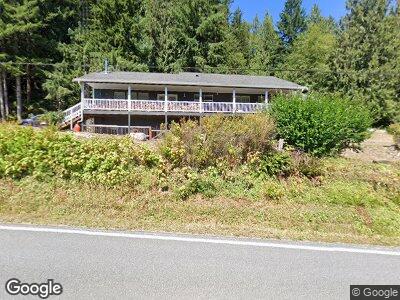
1312 N Carpenter Rd Snohomish, WA 98290
Estimated Value: $1,006,000 - $1,813,000
3
Beds
3
Baths
3,343
Sq Ft
$423/Sq Ft
Est. Value
About This Home
This home is located at 1312 N Carpenter Rd, Snohomish, WA 98290 and is currently estimated at $1,414,285, approximately $423 per square foot. 1312 N Carpenter Rd is a home located in Snohomish County with nearby schools including Granite Falls High School.
Ownership History
Date
Name
Owned For
Owner Type
Purchase Details
Closed on
May 31, 2022
Sold by
Michael Deitch Dennis
Bought by
Carmichael Shelly
Current Estimated Value
Home Financials for this Owner
Home Financials are based on the most recent Mortgage that was taken out on this home.
Original Mortgage
$530,000
Outstanding Balance
$511,933
Interest Rate
5.25%
Mortgage Type
New Conventional
Purchase Details
Closed on
Jun 4, 1998
Sold by
Adan Manolito and Adams Rebecca G
Bought by
Carmichael Shelly R and Deitch Dennis M
Home Financials for this Owner
Home Financials are based on the most recent Mortgage that was taken out on this home.
Original Mortgage
$90,000
Interest Rate
7.17%
Mortgage Type
Seller Take Back
Create a Home Valuation Report for This Property
The Home Valuation Report is an in-depth analysis detailing your home's value as well as a comparison with similar homes in the area
Home Values in the Area
Average Home Value in this Area
Purchase History
| Date | Buyer | Sale Price | Title Company |
|---|---|---|---|
| Carmichael Shelly | -- | Commonwealth Land Title | |
| Carmichael Shelly R | $130,000 | First American Title Co |
Source: Public Records
Mortgage History
| Date | Status | Borrower | Loan Amount |
|---|---|---|---|
| Open | Carmichael Shelly | $530,000 | |
| Previous Owner | Carmichael Shelly R | $330,000 | |
| Previous Owner | Carmichael Shelly R | $330,000 | |
| Previous Owner | Deitch Dennis M | $340,000 | |
| Previous Owner | Deitch Dennis M | $350,000 | |
| Previous Owner | Carmichael Shelly R | $90,000 |
Source: Public Records
Tax History Compared to Growth
Tax History
| Year | Tax Paid | Tax Assessment Tax Assessment Total Assessment is a certain percentage of the fair market value that is determined by local assessors to be the total taxable value of land and additions on the property. | Land | Improvement |
|---|---|---|---|---|
| 2025 | $11,496 | $1,581,200 | $400,200 | $1,181,000 |
| 2024 | $11,496 | $1,465,500 | $379,700 | $1,085,800 |
| 2023 | $11,466 | $1,531,000 | $433,700 | $1,097,300 |
| 2022 | $10,881 | $1,165,500 | $289,600 | $875,900 |
| 2020 | $11,464 | $1,031,800 | $271,600 | $760,200 |
| 2019 | $9,937 | $929,400 | $247,300 | $682,100 |
| 2018 | $9,686 | $819,000 | $181,000 | $638,000 |
| 2017 | $9,057 | $776,500 | $173,100 | $603,400 |
| 2016 | $8,892 | $713,000 | $134,800 | $578,200 |
| 2015 | $9,012 | $669,300 | $126,200 | $543,100 |
| 2013 | $7,628 | $505,100 | $122,200 | $382,900 |
Source: Public Records
Map
Nearby Homes
- 714 N Carpenter Rd
- 4223 203rd Ave NE
- 3110 223rd Ave NE
- 2022 228th Ave NE
- 17629 Newberg Rd
- 19310 Lerch Rd
- 18808 48th St NE
- 4819 E Lake Bosworth Dr
- 2805 Newberg Rd
- 2121 Creswell Rd
- 23204 36th St NE
- 2000 238th Ave NE
- 3521 Alyson Dr
- 0 161st St Unit NWM2264375
- 5108 E Lake Bosworth Dr
- 422 239th Ave NE
- 1311 SW Lake Roesiger Rd
- 507 N Lake Roesiger Rd
- 5617 Lerch Rd
- 1028 S Lake Roesiger Rd
- 1312 N Carpenter Rd
- 1410 N Carpenter Rd
- 209 N Carpenter Rd
- 1220 N Carpenter Rd
- 1228 N Carpenter Rd
- 1115 N Carpenter Rd
- 1101 198th Ave NE
- 207 N Carpenter Rd
- 20102 9th St NE
- 1018 198th Ave NE
- 918 198th Ave NE
- 20831 N Carpenter Rd
- 629 198th Ave NE Unit B
- 629 198th Ave NE
- 727 N Carpenter Rd
- 208 N Carpenter Rd
- 20105 6th St NE
- 800 198th Ave NE
- 20015 6th St NE
- 711 N Carpenter Rd