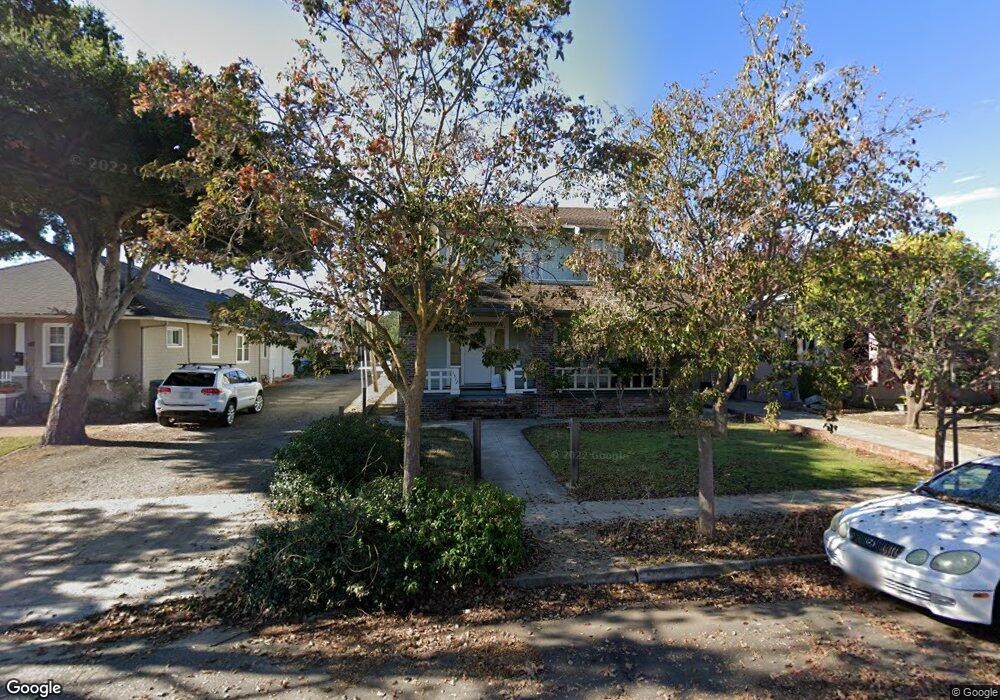
1312 S B St San Mateo, CA 94402
Hayward Park NeighborhoodEstimated Value: $2,243,462 - $2,895,000
3
Beds
2
Baths
2,280
Sq Ft
$1,151/Sq Ft
Est. Value
About This Home
This home is located at 1312 S B St, San Mateo, CA 94402 and is currently estimated at $2,624,154, approximately $1,150 per square foot. 1312 S B St is a home located in San Mateo County with nearby schools including Sunnybrae Elementary School, Borel Middle School, and Aragon High School.
Ownership History
Date
Name
Owned For
Owner Type
Purchase Details
Closed on
Dec 9, 2011
Sold by
Parmenter Lynne M and Fritsche Joel L
Bought by
Fritsche Joel L and Parmenter Lynne M
Current Estimated Value
Home Financials for this Owner
Home Financials are based on the most recent Mortgage that was taken out on this home.
Original Mortgage
$171,000
Interest Rate
3.94%
Mortgage Type
New Conventional
Purchase Details
Closed on
Mar 29, 2002
Sold by
Parmenter Lynne M
Bought by
Parmenter Lynne M and Fritsche Joel L
Purchase Details
Closed on
Mar 27, 2002
Sold by
Parmenter Lynne M and Fuller Susan P
Bought by
Parmenter Lynne M
Purchase Details
Closed on
Jul 5, 2001
Sold by
Parmenter Irma G
Bought by
Parmenter Irma G
Home Financials for this Owner
Home Financials are based on the most recent Mortgage that was taken out on this home.
Original Mortgage
$16,614
Interest Rate
6.84%
Create a Home Valuation Report for This Property
The Home Valuation Report is an in-depth analysis detailing your home's value as well as a comparison with similar homes in the area
Home Values in the Area
Average Home Value in this Area
Purchase History
| Date | Buyer | Sale Price | Title Company |
|---|---|---|---|
| Fritsche Joel L | -- | Calcounties Title Nation Co | |
| Parmenter Lynne M | -- | -- | |
| Parmenter Lynne M | -- | -- | |
| Parmenter Irma G | -- | -- |
Source: Public Records
Mortgage History
| Date | Status | Borrower | Loan Amount |
|---|---|---|---|
| Closed | Fritsche Joel L | $171,000 | |
| Closed | Parmenter Irma G | $16,614 |
Source: Public Records
Tax History Compared to Growth
Tax History
| Year | Tax Paid | Tax Assessment Tax Assessment Total Assessment is a certain percentage of the fair market value that is determined by local assessors to be the total taxable value of land and additions on the property. | Land | Improvement |
|---|---|---|---|---|
| 2025 | $3,604 | $129,238 | $29,362 | $99,876 |
| 2023 | $3,604 | $124,222 | $28,223 | $95,999 |
| 2022 | $3,228 | $121,787 | $27,670 | $94,117 |
| 2021 | $3,042 | $119,400 | $27,128 | $92,272 |
| 2020 | $2,824 | $118,176 | $26,850 | $91,326 |
| 2019 | $2,699 | $115,860 | $26,324 | $89,536 |
| 2018 | $2,141 | $113,589 | $25,808 | $87,781 |
| 2017 | $1,976 | $111,362 | $25,302 | $86,060 |
| 2016 | $2,011 | $109,179 | $24,806 | $84,373 |
| 2015 | $1,984 | $107,540 | $24,434 | $83,106 |
| 2014 | $1,948 | $105,435 | $23,956 | $81,479 |
Source: Public Records
Map
Nearby Homes
- 1107 Palm Ave
- 30 16th Ave
- 118 Rosewood Dr
- 138 Rosewood Dr
- 128 Rosewood Dr
- 1705 Palm Ave Unit 19
- 6 Avila Rd
- 112 Madison Ave Unit 108
- 33 Seville Way
- 1111 Hawthorne Dr
- 724 10th Ave
- 1128 S Grant St Unit S
- 720 Birch Ave
- 908 S Grant St Unit S
- 909 S Grant St
- 1927 Palm Ave
- 1931 Palm Ave
- 555 Laurel Ave Unit 330
- 1225 Carlisle Dr
- 1950 Ivy St