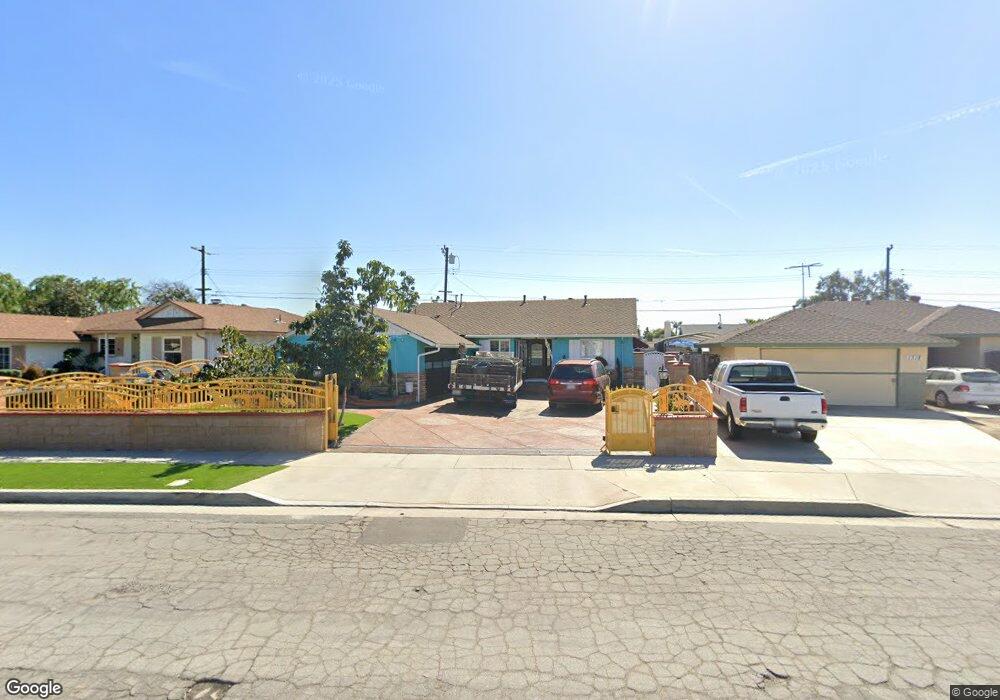
1312 W Ash Ave Fullerton, CA 92833
Estimated Value: $875,206 - $967,000
3
Beds
2
Baths
1,280
Sq Ft
$719/Sq Ft
Est. Value
About This Home
This home is located at 1312 W Ash Ave, Fullerton, CA 92833 and is currently estimated at $920,552, approximately $719 per square foot. 1312 W Ash Ave is a home located in Orange County with nearby schools including Pacific Drive Elementary School, Nicolas Junior High School, and Fullerton Union High School.
Ownership History
Date
Name
Owned For
Owner Type
Purchase Details
Closed on
Dec 4, 2018
Sold by
Cisneros Martin Ruiz
Bought by
Cisneros Martin Ruiz and The Martin Ruiz Living Trust
Current Estimated Value
Purchase Details
Closed on
Jan 26, 2005
Sold by
Ruiz Nicolas
Bought by
Ruiz Martin and Ruiz Maria R
Purchase Details
Closed on
Jun 14, 1996
Sold by
Ewing Madeleine B
Bought by
Ruiz Martin and Ruiz Maria R
Home Financials for this Owner
Home Financials are based on the most recent Mortgage that was taken out on this home.
Original Mortgage
$136,800
Outstanding Balance
$8,748
Interest Rate
8.01%
Estimated Equity
$911,804
Purchase Details
Closed on
Jan 27, 1993
Sold by
Flock Charles W and Flock Dorothy J
Bought by
Ewing Madeleine B
Home Financials for this Owner
Home Financials are based on the most recent Mortgage that was taken out on this home.
Original Mortgage
$142,800
Interest Rate
7.88%
Create a Home Valuation Report for This Property
The Home Valuation Report is an in-depth analysis detailing your home's value as well as a comparison with similar homes in the area
Purchase History
| Date | Buyer | Sale Price | Title Company |
|---|---|---|---|
| Cisneros Martin Ruiz | -- | None Available | |
| Ruiz Martin | -- | -- | |
| Ruiz Martin | $171,000 | Chicago Title Co | |
| Ewing Madeleine B | $190,500 | South Coast Title Company |
Source: Public Records
Mortgage History
| Date | Status | Borrower | Loan Amount |
|---|---|---|---|
| Open | Ruiz Martin | $136,800 | |
| Previous Owner | Ewing Madeleine B | $142,800 |
Source: Public Records
Tax History
| Year | Tax Paid | Tax Assessment Tax Assessment Total Assessment is a certain percentage of the fair market value that is determined by local assessors to be the total taxable value of land and additions on the property. | Land | Improvement |
|---|---|---|---|---|
| 2025 | $4,581 | $407,749 | $316,094 | $91,655 |
| 2024 | $4,581 | $399,754 | $309,896 | $89,858 |
| 2023 | $4,469 | $391,916 | $303,819 | $88,097 |
| 2022 | $4,435 | $384,232 | $297,862 | $86,370 |
| 2021 | $4,358 | $376,699 | $292,022 | $84,677 |
| 2020 | $4,332 | $372,837 | $289,028 | $83,809 |
| 2019 | $4,221 | $365,527 | $283,361 | $82,166 |
| 2018 | $4,157 | $358,360 | $277,805 | $80,555 |
| 2017 | $4,087 | $351,334 | $272,358 | $78,976 |
| 2016 | $4,002 | $344,446 | $267,018 | $77,428 |
| 2015 | $3,891 | $339,273 | $263,008 | $76,265 |
| 2014 | $3,778 | $332,628 | $257,856 | $74,772 |
Source: Public Records
Map
Nearby Homes
- 618 S Lee Ave
- 1201 W Valencia Dr Unit 39
- 1201 W Valencia Dr Unit 88
- 1201 W Valencia Dr Unit 150
- 1201 W Valencia Dr Unit 146
- 1201 W Valencia Dr Unit 120
- 128 S Citrus Ave
- 1108 Williamson Ave
- 637 Liberation Way
- 1510 W Orangethorpe Ave
- 1412 W Baker Ave
- 1501 S Royer Ave
- 1467 W Roberta Ave
- 1507 S Citrus Ave
- 1513 W Malvern Ave
- 506 W Rosslynn Ave
- 751 Stephens Ave
- 539 W Amerige Ave
- 1836 W Southgate Ave
- 1919 W Coronet Ave Unit 75
Your Personal Tour Guide
Ask me questions while you tour the home.