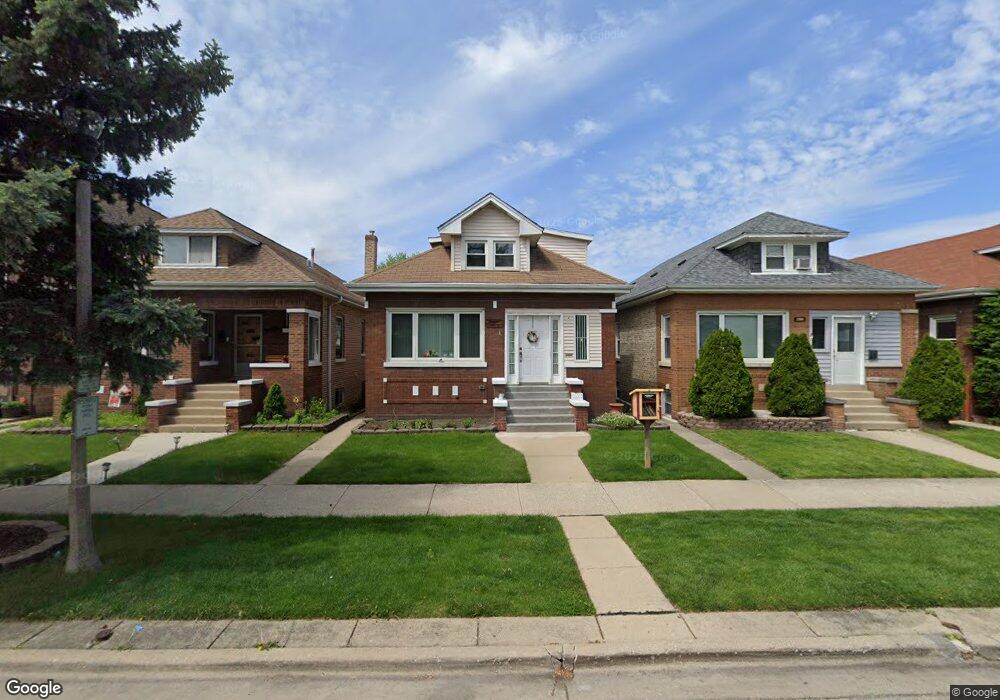
1312 Wesley Ave Berwyn, IL 60402
Estimated Value: $316,745 - $404,000
3
Beds
2
Baths
1,714
Sq Ft
$209/Sq Ft
Est. Value
About This Home
This home is located at 1312 Wesley Ave, Berwyn, IL 60402 and is currently estimated at $358,186, approximately $208 per square foot. 1312 Wesley Ave is a home located in Cook County with nearby schools including Prairie Oak School, Lincoln Middle School, and J. Sterling Morton High School West.
Ownership History
Date
Name
Owned For
Owner Type
Purchase Details
Closed on
Mar 28, 2011
Sold by
Marquez Joe Luis and Cook County Judge
Bought by
Marquez Juanita
Current Estimated Value
Purchase Details
Closed on
Jan 30, 2004
Sold by
Marquez Joe L and Marquez Juanita G
Bought by
Marquez Joe L and Marquez Juanita G
Home Financials for this Owner
Home Financials are based on the most recent Mortgage that was taken out on this home.
Original Mortgage
$157,500
Interest Rate
9.34%
Mortgage Type
New Conventional
Purchase Details
Closed on
Dec 31, 1993
Sold by
Miara Henry K and Miara Eleanor A
Bought by
Marquez Joe L and Gonzalez Juanita G
Home Financials for this Owner
Home Financials are based on the most recent Mortgage that was taken out on this home.
Original Mortgage
$94,914
Interest Rate
7.29%
Mortgage Type
FHA
Create a Home Valuation Report for This Property
The Home Valuation Report is an in-depth analysis detailing your home's value as well as a comparison with similar homes in the area
Home Values in the Area
Average Home Value in this Area
Purchase History
| Date | Buyer | Sale Price | Title Company |
|---|---|---|---|
| Marquez Juanita | -- | -- | |
| Marquez Juanita | -- | -- | |
| Marquez Juanita | -- | -- | |
| Marquez Joe L | -- | Netco | |
| Marquez Joe L | $63,333 | -- |
Source: Public Records
Mortgage History
| Date | Status | Borrower | Loan Amount |
|---|---|---|---|
| Previous Owner | Marquez Joe L | $157,500 | |
| Previous Owner | Marquez Joe L | $94,914 |
Source: Public Records
Tax History
| Year | Tax Paid | Tax Assessment Tax Assessment Total Assessment is a certain percentage of the fair market value that is determined by local assessors to be the total taxable value of land and additions on the property. | Land | Improvement |
|---|---|---|---|---|
| 2025 | $3,394 | $25,582 | $4,253 | $21,329 |
| 2024 | $3,394 | $25,582 | $4,253 | $21,329 |
| 2023 | $5,560 | $25,582 | $4,253 | $21,329 |
| 2022 | $5,560 | $17,295 | $3,686 | $13,609 |
| 2021 | $5,330 | $17,294 | $3,685 | $13,609 |
| 2020 | $5,275 | $17,294 | $3,685 | $13,609 |
| 2019 | $5,287 | $16,248 | $3,307 | $12,941 |
| 2018 | $5,076 | $16,248 | $3,307 | $12,941 |
| 2017 | $5,847 | $18,602 | $3,307 | $15,295 |
| 2016 | $3,108 | $9,844 | $2,740 | $7,104 |
| 2015 | $3,819 | $11,824 | $2,740 | $9,084 |
| 2014 | $2,994 | $11,824 | $2,740 | $9,084 |
| 2013 | $3,661 | $12,835 | $2,740 | $10,095 |
Source: Public Records
Map
Nearby Homes
- 1335 Wesley Ave
- 1324 East Ave
- 1185 Clarence Ave
- 1192 Clarence Ave Unit 1
- 1192 Clarence Ave Unit 3
- 1325 Scoville Ave
- 1245 Kenilworth Ave
- 1435 Grove Ave
- 1403 Kenilworth Ave
- 1445 East Ave
- 1170 S East Ave
- 1426 Gunderson Ave
- 1324 Clinton Ave
- 1135 S Oak Park Ave
- 1510 Gunderson Ave
- 1122 S Oak Park Ave
- 1513 Clinton Ave
- 1629 Euclid Ave
- 1161 S Ridgeland Ave
- 6337 Roosevelt Rd Unit 103
- 1308 Wesley Ave
- 1306 Wesley Ave
- 1302 Wesley Ave
- 1322 Wesley Ave
- 1311 Euclid Ave
- 1307 Euclid Ave
- 1313 Euclid Ave
- 1324 Wesley Ave
- 1305 Euclid Ave
- 1315 Euclid Ave
- 1319 Euclid Ave
- 1301 Euclid Ave
- 1326 Wesley Ave
- 1321 Euclid Ave
- 1303 Euclid Ave
- 1311 Wesley Ave
- 1313 Wesley Ave
- 1309 Wesley Ave
- 1315 Wesley Ave
- 1305 Wesley Ave
Your Personal Tour Guide
Ask me questions while you tour the home.