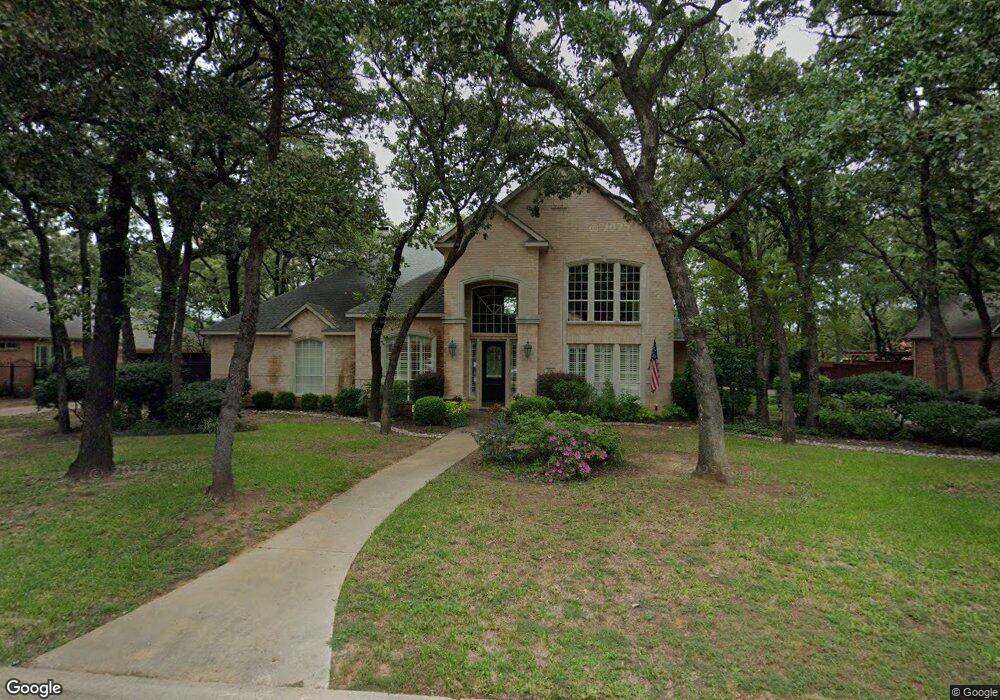
1312 Westmont Ct Southlake, TX 76092
Estimated Value: $1,268,867 - $1,466,000
5
Beds
5
Baths
3,930
Sq Ft
$353/Sq Ft
Est. Value
About This Home
This home is located at 1312 Westmont Ct, Southlake, TX 76092 and is currently estimated at $1,387,217, approximately $352 per square foot. 1312 Westmont Ct is a home located in Tarrant County with nearby schools including Old Union Elementary School, Eubanks Intermediate School, and George Dawson Middle School.
Ownership History
Date
Name
Owned For
Owner Type
Purchase Details
Closed on
Sep 12, 2014
Sold by
The Grsw Stewart Real Estate Trust
Bought by
Crane William D and Crane Lisa H
Current Estimated Value
Purchase Details
Closed on
May 31, 2000
Sold by
Teng Samuel S and Teng Christine M
Bought by
Eddy Kyle W and Eddy Daye H
Home Financials for this Owner
Home Financials are based on the most recent Mortgage that was taken out on this home.
Original Mortgage
$296,000
Interest Rate
8.17%
Purchase Details
Closed on
Nov 27, 1996
Sold by
Murchison Properties Inc
Bought by
Teng Samuel S and Teng Christine M
Home Financials for this Owner
Home Financials are based on the most recent Mortgage that was taken out on this home.
Original Mortgage
$275,000
Interest Rate
7.85%
Create a Home Valuation Report for This Property
The Home Valuation Report is an in-depth analysis detailing your home's value as well as a comparison with similar homes in the area
Home Values in the Area
Average Home Value in this Area
Purchase History
| Date | Buyer | Sale Price | Title Company |
|---|---|---|---|
| Crane William D | -- | Stewart | |
| The Grsw Stewart Real Estate Trust | -- | Stewart | |
| Eddy Kyle W | -- | Ticor Land Title Co | |
| Teng Samuel S | -- | American Title Company |
Source: Public Records
Mortgage History
| Date | Status | Borrower | Loan Amount |
|---|---|---|---|
| Previous Owner | Eddy Kyle W | $296,000 | |
| Previous Owner | Teng Samuel S | $275,000 | |
| Closed | Eddy Kyle W | $55,500 |
Source: Public Records
Tax History Compared to Growth
Tax History
| Year | Tax Paid | Tax Assessment Tax Assessment Total Assessment is a certain percentage of the fair market value that is determined by local assessors to be the total taxable value of land and additions on the property. | Land | Improvement |
|---|---|---|---|---|
| 2025 | $9,004 | $1,087,000 | $345,375 | $741,625 |
| 2024 | $9,004 | $1,087,000 | $345,375 | $741,625 |
| 2023 | $14,075 | $1,162,402 | $345,375 | $817,027 |
| 2022 | $15,145 | $702,000 | $230,250 | $471,750 |
| 2021 | $16,006 | $702,000 | $230,250 | $471,750 |
| 2020 | $14,734 | $641,000 | $207,225 | $433,775 |
| 2019 | $17,527 | $723,805 | $150,000 | $573,805 |
| 2018 | $12,740 | $672,165 | $150,000 | $522,165 |
| 2017 | $15,446 | $631,479 | $150,000 | $481,479 |
| 2016 | $14,041 | $651,860 | $150,000 | $501,860 |
| 2015 | $12,946 | $515,000 | $80,000 | $435,000 |
| 2014 | $12,946 | $550,100 | $80,000 | $470,100 |
Source: Public Records
Map
Nearby Homes
- 1304 Kings Brook Ct
- 223 Westwood Dr
- 1591 Main St
- 1577 Main St
- 702 Sussex Ct
- 215 Park Ridge Blvd
- 231 Park Ridge Blvd
- 350 Central Ave Unit 202
- 350 Central Ave Unit 503
- 350 Central Ave Unit 201
- 350 Central Ave Unit 307
- 350 Central Ave Unit 310
- 1032 Rosavine Dr
- 1028 Rosavine Dr
- 1017 Rosavine Dr
- 1004 Rosavine Dr
- 1020 Rosavine Dr
- 1012 Rosavine Dr
- 1024 Rosavine Dr
- 1005 Rosavine Dr
- 1310 Westmont Ct
- 1314 Westmont Ct
- 1313 Westmont Ct
- 1308 Westmont Ct
- 1316 Westmont Ct
- 1311 Westmont Ct
- 1315 Westmont Ct
- 1309 Westmont Ct
- 1317 Westmont Ct
- 1306 Westmont Ct
- 1318 Westmont Ct
- 1312 Forest Hills Ct
- 1307 Westmont Ct
- 1310 Forest Hills Ct
- 1319 Westmont Ct
- 1314 Forest Hills Ct
- 1308 Forest Hills Ct
- 1304 Westmont Ct
- 1316 Forest Hills Ct
- 1305 Westmont Ct