Estimated Value: $1,341,000 - $1,471,000
4
Beds
2
Baths
2,120
Sq Ft
$668/Sq Ft
Est. Value
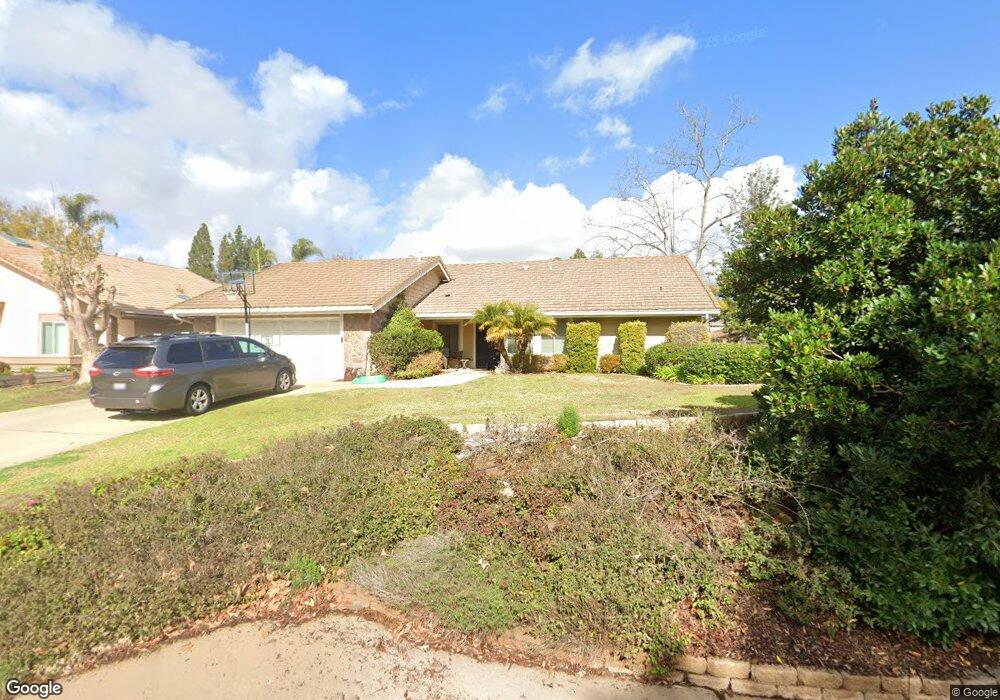
About This Home
This home is located at 13120 Grape Arbor Way, Poway, CA 92064 and is currently estimated at $1,415,321, approximately $667 per square foot. 13120 Grape Arbor Way is a home located in San Diego County with nearby schools including Chaparral Elementary, Twin Peaks Middle, and Poway High.
Ownership History
Date
Name
Owned For
Owner Type
Purchase Details
Closed on
Aug 17, 2005
Sold by
Bai Chuanyong and Fu Sherry S
Bought by
Bai Chuanyong and Fu Sherry S
Current Estimated Value
Home Financials for this Owner
Home Financials are based on the most recent Mortgage that was taken out on this home.
Original Mortgage
$550,000
Outstanding Balance
$214,509
Interest Rate
1.75%
Mortgage Type
Stand Alone Refi Refinance Of Original Loan
Estimated Equity
$1,200,812
Purchase Details
Closed on
Sep 23, 2003
Sold by
Marks Ira and Marks Eileen
Bought by
Morling Steven and Rowe Morling Dawn
Home Financials for this Owner
Home Financials are based on the most recent Mortgage that was taken out on this home.
Original Mortgage
$464,000
Interest Rate
6.4%
Mortgage Type
Unknown
Purchase Details
Closed on
Jan 15, 2001
Sold by
Bailey Byron W and Bailey Sharon T
Bought by
Marks Ira and Marks Eileen
Home Financials for this Owner
Home Financials are based on the most recent Mortgage that was taken out on this home.
Original Mortgage
$340,000
Interest Rate
6.37%
Purchase Details
Closed on
Feb 28, 1983
Create a Home Valuation Report for This Property
The Home Valuation Report is an in-depth analysis detailing your home's value as well as a comparison with similar homes in the area
Home Values in the Area
Average Home Value in this Area
Purchase History
| Date | Buyer | Sale Price | Title Company |
|---|---|---|---|
| Bai Chuanyong | -- | Ticor Title Co Of California | |
| Morling Steven | $580,000 | Fidelity National Title Co | |
| Marks Ira | $425,000 | Chicago Title Co | |
| -- | $179,900 | -- |
Source: Public Records
Mortgage History
| Date | Status | Borrower | Loan Amount |
|---|---|---|---|
| Open | Bai Chuanyong | $550,000 | |
| Closed | Morling Steven | $464,000 | |
| Previous Owner | Marks Ira | $340,000 |
Source: Public Records
Tax History
| Year | Tax Paid | Tax Assessment Tax Assessment Total Assessment is a certain percentage of the fair market value that is determined by local assessors to be the total taxable value of land and additions on the property. | Land | Improvement |
|---|---|---|---|---|
| 2025 | $10,588 | $961,719 | $599,333 | $362,386 |
| 2024 | $10,588 | $942,863 | $587,582 | $355,281 |
| 2023 | $10,363 | $924,376 | $576,061 | $348,315 |
| 2022 | $10,190 | $906,252 | $564,766 | $341,486 |
| 2021 | $8,606 | $760,000 | $535,000 | $225,000 |
| 2020 | $8,240 | $730,000 | $514,000 | $216,000 |
| 2019 | $7,962 | $710,000 | $500,000 | $210,000 |
| 2018 | $7,892 | $710,000 | $501,000 | $209,000 |
| 2017 | $171 | $665,000 | $470,000 | $195,000 |
| 2016 | $7,167 | $650,000 | $460,000 | $190,000 |
| 2015 | $6,837 | $620,000 | $439,000 | $181,000 |
| 2014 | $6,590 | $600,000 | $425,000 | $175,000 |
Source: Public Records
Map
Nearby Homes
- 13253 Edina Way
- 17240 Cuvee Ct
- 16883 Saint Andrews Dr
- 17502 Corte Lomas Verdes
- 17407 Port Marnock Dr
- 17415 Port Marnock Dr Unit 43
- 17526 Saint Andrews Dr
- 17337 Plaza Maria
- 17461 Plaza Otonal Unit 401
- 17444 Plaza Otonal Unit 357
- 17488 Plaza Otonal
- 13665 White Rock Station Rd
- 13625 Antelope Station
- 12782 Jardin Rd
- 17503 Plaza Dolores
- 17721 Valle de Lobo Dr
- 17525 Plaza Gitana
- 17465 Plaza Animado Unit 147
- 17780 Villamoura Dr Unit 29
- 17680 Caminito Balata
- 13112 Grape Arbor Way
- 13128 Grape Arbor Way
- 13104 Grape Arbor Way
- 17202 Merlot Place
- 13103 Grape Arbor Way
- 17201 Merlot Place
- 17132 Grape Arbor Ct
- 17124 Grape Arbor Ct
- 17208 Merlot Place
- 17121 Grape Arbor Ct
- 17211 Vendor Place
- 13205 Vinter Way
- 17207 Merlot Place
- 17204 Vendor Place
- 13211 Vinter Way
- 17116 Grape Arbor Ct
- 13230 Vinter Way
- 17217 Vendor Place
- 17214 Merlot Place
- 13109 Pomard Way
Your Personal Tour Guide
Ask me questions while you tour the home.