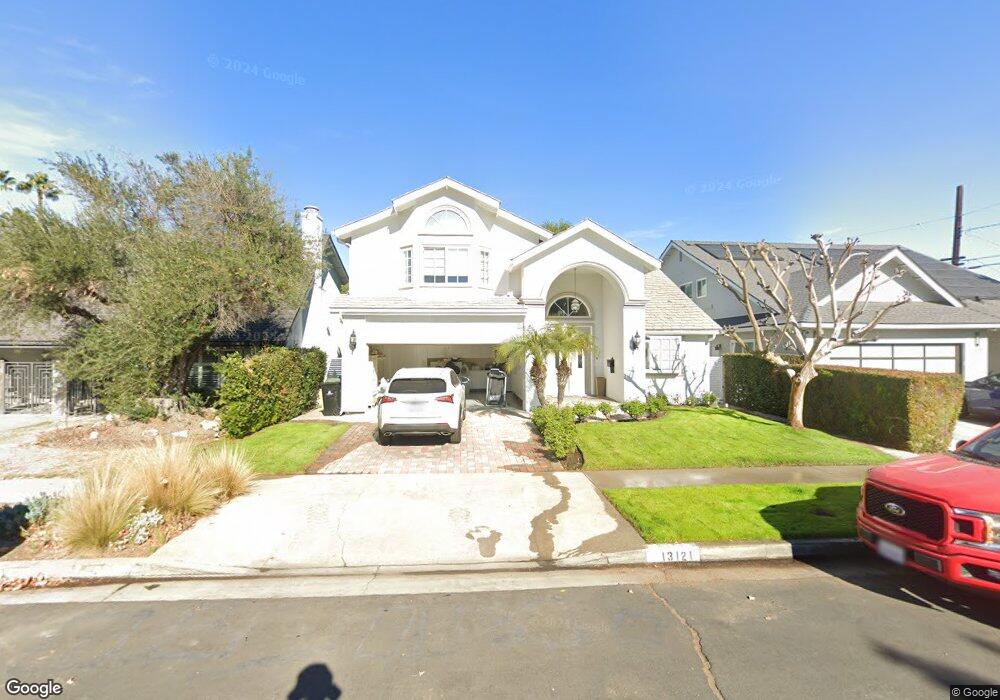
13121 Morrison St Sherman Oaks, CA 91423
Estimated Value: $1,965,018 - $2,437,000
5
Beds
4
Baths
3,161
Sq Ft
$694/Sq Ft
Est. Value
About This Home
This home is located at 13121 Morrison St, Sherman Oaks, CA 91423 and is currently estimated at $2,193,005, approximately $693 per square foot. 13121 Morrison St is a home located in Los Angeles County with nearby schools including Ulysses S. Grant Senior High School, Riverside Drive Charter Elementary School, and Dixie Canyon Avenue Elementary School.
Ownership History
Date
Name
Owned For
Owner Type
Purchase Details
Closed on
Jun 16, 2009
Sold by
Rubinstein Mazal
Bought by
Rubinstein Mazal and Mazal Rubinstein Trust
Current Estimated Value
Purchase Details
Closed on
Oct 31, 2008
Sold by
Rubinstein Arturo and Rubenstein Arturo
Bought by
Rubinstein Mazal
Purchase Details
Closed on
Jul 7, 1998
Sold by
Rubinstein Mazal
Bought by
Rubinstein Art
Home Financials for this Owner
Home Financials are based on the most recent Mortgage that was taken out on this home.
Original Mortgage
$300,000
Outstanding Balance
$50,702
Interest Rate
4.95%
Estimated Equity
$2,142,303
Purchase Details
Closed on
Jun 30, 1998
Sold by
Gougelet Jean Rene and Gougelet Catherine R
Bought by
Rubinstein Art
Home Financials for this Owner
Home Financials are based on the most recent Mortgage that was taken out on this home.
Original Mortgage
$300,000
Outstanding Balance
$50,702
Interest Rate
4.95%
Estimated Equity
$2,142,303
Create a Home Valuation Report for This Property
The Home Valuation Report is an in-depth analysis detailing your home's value as well as a comparison with similar homes in the area
Home Values in the Area
Average Home Value in this Area
Purchase History
| Date | Buyer | Sale Price | Title Company |
|---|---|---|---|
| Rubinstein Mazal | -- | None Available | |
| Rubinstein Mazal | -- | None Available | |
| Rubinstein Art | -- | Commonwealth Land Title Co | |
| Rubinstein Art | $425,000 | Commonwealth Title |
Source: Public Records
Mortgage History
| Date | Status | Borrower | Loan Amount |
|---|---|---|---|
| Open | Rubinstein Art | $300,000 |
Source: Public Records
Tax History Compared to Growth
Tax History
| Year | Tax Paid | Tax Assessment Tax Assessment Total Assessment is a certain percentage of the fair market value that is determined by local assessors to be the total taxable value of land and additions on the property. | Land | Improvement |
|---|---|---|---|---|
| 2025 | $8,837 | $722,706 | $274,965 | $447,741 |
| 2024 | $8,837 | $708,536 | $269,574 | $438,962 |
| 2023 | $8,668 | $694,644 | $264,289 | $430,355 |
| 2022 | $8,269 | $681,024 | $259,107 | $421,917 |
| 2021 | $8,153 | $667,672 | $254,027 | $413,645 |
| 2019 | $7,910 | $647,871 | $246,494 | $401,377 |
| 2018 | $7,782 | $635,168 | $241,661 | $393,507 |
| 2016 | $7,411 | $610,506 | $232,278 | $378,228 |
| 2015 | $7,302 | $601,336 | $228,789 | $372,547 |
| 2014 | $7,329 | $589,558 | $224,308 | $365,250 |
Source: Public Records
Map
Nearby Homes
- 13158 Otsego St
- 4938 Morse Ave
- 4800 Mary Ellen Ave
- 13157 Otsego St
- 13128 Hartsook St
- 12947 La Maida St
- 5109 Longridge Ave
- 4822 Van Noord Ave Unit 6
- 4859 Coldwater Canyon Ave Unit 12
- 5055 Coldwater Canyon Ave Unit 217
- 4719 Wortser Ave
- 13232 Magnolia Blvd
- 12940 Riverside Dr Unit 108
- 12940 Riverside Dr Unit 102
- 12940 Riverside Dr Unit 101
- 13117 Magnolia Blvd
- 4838 Coldwater Canyon Ave
- 5050 Coldwater Canyon Ave Unit 306
- 5050 Coldwater Canyon Ave Unit 310
- 4702 Fulton Ave Unit 107
- 13115 Morrison St
- 13127 Morrison St
- 13133 Morrison St
- 13122 Addison St
- 13126 Addison St
- 13101 Morrison St
- 13132 Addison St
- 4949 Ethel Ave
- 13141 Morrison St
- 13136 Addison St
- 13120 Morrison St
- 13114 Morrison St
- 13126 Morrison St
- 4923 Ethel Ave
- 13132 Morrison St
- 13100 Addison St
- 13140 Addison St
- 13145 Morrison St
- 4917 Ethel Ave
- 13140 Morrison St