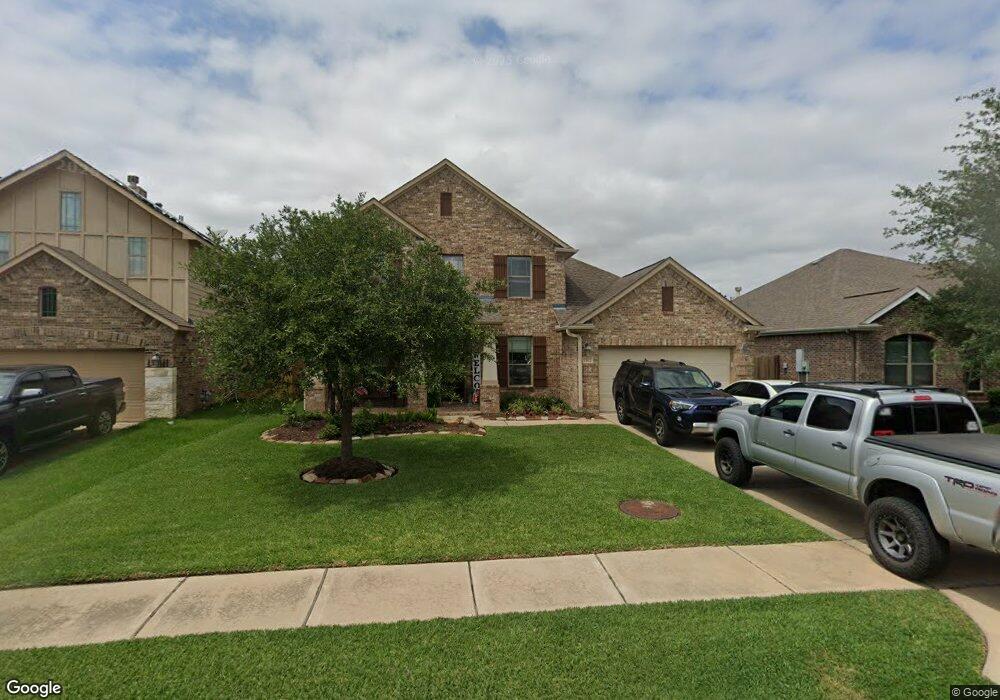
13122 Northwood Glen Ln Tomball, TX 77377
Northpointe NeighborhoodEstimated Value: $426,000 - $493,000
4
Beds
3
Baths
2,954
Sq Ft
$153/Sq Ft
Est. Value
About This Home
This home is located at 13122 Northwood Glen Ln, Tomball, TX 77377 and is currently estimated at $451,890, approximately $152 per square foot. 13122 Northwood Glen Ln is a home with nearby schools including Wildwood Elementary School, Oakcrest Intermediate School, and Tomball Memorial High School.
Ownership History
Date
Name
Owned For
Owner Type
Purchase Details
Closed on
Apr 17, 2019
Sold by
Wieland Arnold and Wieland Ashley C
Bought by
Wieland Ashley C and Wall Jeffrey
Current Estimated Value
Home Financials for this Owner
Home Financials are based on the most recent Mortgage that was taken out on this home.
Original Mortgage
$244,000
Outstanding Balance
$214,083
Interest Rate
4.2%
Mortgage Type
Stand Alone First
Estimated Equity
$237,807
Purchase Details
Closed on
Oct 4, 2012
Sold by
Gehan Homes Ltd
Bought by
Haynes Jessica Lynn and Haynes Christopher Anthony
Home Financials for this Owner
Home Financials are based on the most recent Mortgage that was taken out on this home.
Original Mortgage
$203,252
Interest Rate
3.75%
Mortgage Type
FHA
Purchase Details
Closed on
Apr 10, 2006
Sold by
Villages Of Northpointe West Lp
Bought by
Vantage Builders Of Texas Lp
Create a Home Valuation Report for This Property
The Home Valuation Report is an in-depth analysis detailing your home's value as well as a comparison with similar homes in the area
Home Values in the Area
Average Home Value in this Area
Purchase History
| Date | Buyer | Sale Price | Title Company |
|---|---|---|---|
| Wieland Ashley C | -- | Texas National Title | |
| Haynes Jessica Lynn | $203,252 | Empire Title Co Ltd | |
| Vantage Builders Of Texas Lp | -- | Stewart Title Houston Div |
Source: Public Records
Mortgage History
| Date | Status | Borrower | Loan Amount |
|---|---|---|---|
| Open | Wieland Ashley C | $244,000 | |
| Closed | Haynes Jessica Lynn | $203,252 |
Source: Public Records
Tax History Compared to Growth
Tax History
| Year | Tax Paid | Tax Assessment Tax Assessment Total Assessment is a certain percentage of the fair market value that is determined by local assessors to be the total taxable value of land and additions on the property. | Land | Improvement |
|---|---|---|---|---|
| 2025 | $9,692 | $469,470 | $74,766 | $394,704 |
| 2024 | $9,692 | $453,171 | $69,426 | $383,745 |
| 2023 | $9,692 | $450,628 | $64,085 | $386,543 |
| 2022 | $10,025 | $412,546 | $64,085 | $348,461 |
| 2021 | $9,640 | $315,397 | $44,504 | $270,893 |
| 2020 | $9,584 | $300,563 | $44,504 | $256,059 |
| 2019 | $9,341 | $285,358 | $37,027 | $248,331 |
| 2018 | $3,319 | $272,666 | $37,027 | $235,639 |
| 2017 | $9,115 | $272,666 | $37,027 | $235,639 |
| 2016 | $9,115 | $272,666 | $37,027 | $235,639 |
| 2015 | $8,063 | $272,666 | $37,027 | $235,639 |
| 2014 | $8,063 | $250,000 | $37,027 | $212,973 |
Source: Public Records
Map
Nearby Homes
- 18618 Oden Trace Dr
- 12918 Chatfield Manor Ln
- 13522 Carrill Bend Ln
- 18931 Winding Atwood Ln
- 18710 Winding Atwood Ln
- 19023 Wild Thornberry Dr
- 13315 Edison Trace Ln
- 12327 Northpointe Ridge Ln
- 19006 Rustling Ridge Ln
- 18218 Russett Green Dr
- 18803 Dusty Rose Ln
- 18603 Bridle Grove Ct
- 12719 Rocky Briar Ln
- 19026 Rustling Ridge Ln
- 18402 Sierra Falls Ct
- 12902 Frontier Creek Ct
- 18630 Luma Cove Ln
- 18626 Luma Cove Ln
- 13914 Sedgefield Creek Trace
- 18522 Cascade Timbers Ln
- 13118 Northwood Glen Ln
- 13126 Northwood Glen Ln
- 13114 Northwood Glen Ln
- 13135 Chatfield Manor Ln
- 13139 Chatfield Manor Ln
- 13131 Chatfield Manor Ln
- 13123 Northwood Glen Ln
- 13119 Northwood Glen Ln
- 13127 Chatfield Manor Ln
- 13127 Northwood Glen Ln
- 13111 Northwood Glen Ln
- 13123 Chatfield Manor Ln
- 13131 Northwood Glen Ln
- 13106 Northwood Glen Ln
- 13143 Chatfield Manor Ln
- 13107 Northwood Glen Ln
- 13119 Chatfield Manor Ln
- 13135 Northwood Glen Ln
- 13103 Northwood Glen Ln
- 13102 Northwood Glen Ln