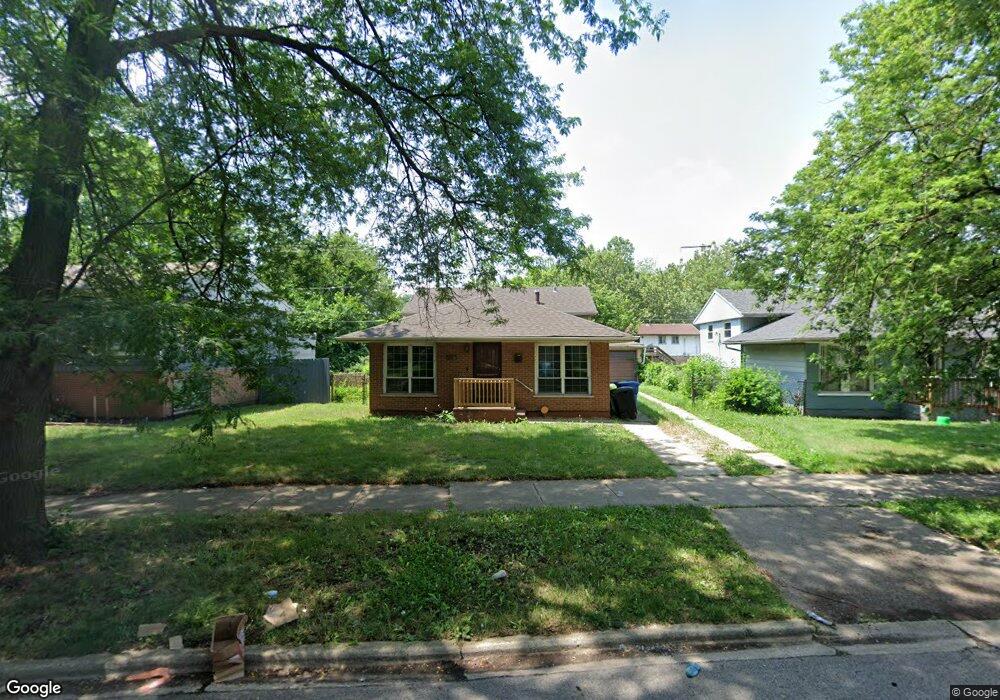
13122 S Rhodes Ave Chicago, IL 60827
Estimated Value: $93,000 - $100,000
3
Beds
1
Bath
987
Sq Ft
$97/Sq Ft
Est. Value
About This Home
This home is located at 13122 S Rhodes Ave, Chicago, IL 60827 and is currently estimated at $95,714, approximately $96 per square foot. 13122 S Rhodes Ave is a home located in Cook County with nearby schools including Aldridge Elementary School, Fenger Academy High School, and CICS - Bond Campus.
Ownership History
Date
Name
Owned For
Owner Type
Purchase Details
Closed on
Mar 20, 2024
Sold by
Pearl Hospitality Manager Llc
Bought by
Bricksave 255 Llc
Current Estimated Value
Purchase Details
Closed on
Oct 27, 2023
Sold by
Community Initiatives Inc
Bought by
Pearl Hospitality Manager Llc
Purchase Details
Closed on
Sep 20, 2023
Sold by
Stanwich Mtg Loan Tr
Bought by
Community Initiatives Inc
Purchase Details
Closed on
Jul 27, 2023
Sold by
Judicial Sales Corporation
Bought by
Stanwich Mtg Loan Tr and Sampson
Purchase Details
Closed on
Mar 1, 2001
Sold by
Heritage Community Bank
Bought by
Sampson Ruth
Home Financials for this Owner
Home Financials are based on the most recent Mortgage that was taken out on this home.
Original Mortgage
$60,678
Interest Rate
7.13%
Mortgage Type
FHA
Purchase Details
Closed on
Apr 7, 1998
Sold by
Emc Mtg Corp
Bought by
Riverside Redevelopment Corp
Create a Home Valuation Report for This Property
The Home Valuation Report is an in-depth analysis detailing your home's value as well as a comparison with similar homes in the area
Home Values in the Area
Average Home Value in this Area
Purchase History
| Date | Buyer | Sale Price | Title Company |
|---|---|---|---|
| Bricksave 255 Llc | $82,500 | None Listed On Document | |
| Pearl Hospitality Manager Llc | $62,000 | First American Title | |
| Community Initiatives Inc | $57,000 | First American Title | |
| Stanwich Mtg Loan Tr | -- | None Listed On Document | |
| Sampson Ruth | $62,000 | -- | |
| Riverside Redevelopment Corp | $24,500 | -- |
Source: Public Records
Mortgage History
| Date | Status | Borrower | Loan Amount |
|---|---|---|---|
| Previous Owner | Sampson Ruth | $60,678 | |
| Closed | Sampson Ruth | $5,000 |
Source: Public Records
Tax History Compared to Growth
Tax History
| Year | Tax Paid | Tax Assessment Tax Assessment Total Assessment is a certain percentage of the fair market value that is determined by local assessors to be the total taxable value of land and additions on the property. | Land | Improvement |
|---|---|---|---|---|
| 2024 | -- | $7,001 | $1,873 | $5,128 |
| 2023 | -- | $3,000 | $1,605 | $1,395 |
| 2022 | $0 | $3,000 | $1,605 | $1,395 |
| 2021 | $692 | $3,000 | $1,605 | $1,395 |
| 2020 | $692 | $6,201 | $2,140 | $4,061 |
| 2019 | $697 | $6,891 | $2,140 | $4,751 |
| 2018 | $684 | $6,891 | $2,140 | $4,751 |
| 2017 | $849 | $7,312 | $1,872 | $5,440 |
| 2016 | $967 | $7,312 | $1,872 | $5,440 |
| 2015 | $861 | $7,312 | $1,872 | $5,440 |
| 2014 | $830 | $7,029 | $1,605 | $5,424 |
| 2013 | $802 | $7,029 | $1,605 | $5,424 |
Source: Public Records
Map
Nearby Homes
- 13041 S Eberhart Ave
- 13144 S Vernon Ave
- 13228 S Rhodes Ave
- 13240 S Saint Lawrence Ave
- 13249 S Vernon Ave
- 13308 S Riverdale Ave
- 14836 S Langley Ave
- 14315 S Dobson Ave
- 219 E 136th St
- 307 E 136th Place
- 12613 S Michigan Ave
- 72 E 136th St
- 15 E 126th St
- 59 E 137th St
- 46 E Brayton St
- 320 E 138th St
- 13823 Lincoln Ave
- 13824 Forest Ave
- 225 E 138th St
- 12473 S Wabash Ave
- 13224 S Rhodes Ave
- 13224 S Rhodes Ave
- 13116 S Rhodes Ave
- 13132 S Rhodes Ave
- 13127 S Eberhart Ave
- 13121 S Eberhart Ave
- 13110 S Rhodes Ave
- 13131 S Eberhart Ave
- 13119 S Eberhart Ave
- 13138 S Rhodes Ave
- 13137 S Eberhart Ave
- 13113 S Eberhart Ave
- 13106 S Rhodes Ave
- 13121 S Rhodes Ave
- 13117 S Rhodes Ave
- 13127 S Rhodes Ave
- 13140 S Rhodes Ave
- 13111 S Rhodes Ave
- 13131 S Rhodes Ave
- 13107 S Eberhart Ave