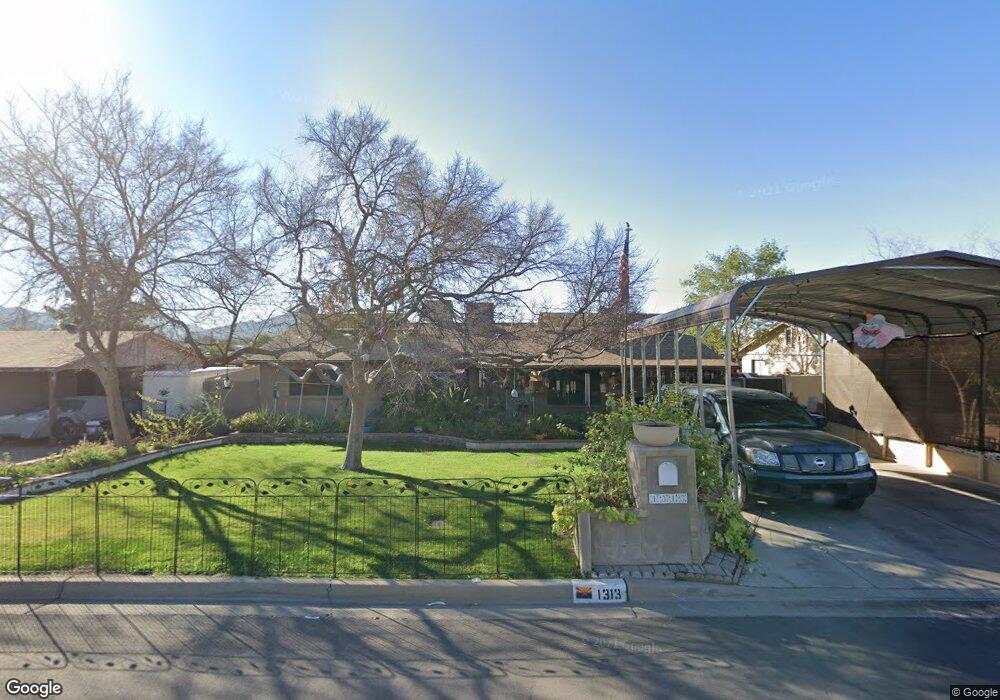
1313 E Sahuaro Dr Phoenix, AZ 85020
North Mountain Village NeighborhoodEstimated Value: $315,706 - $456,000
Studio
2
Baths
1,664
Sq Ft
$247/Sq Ft
Est. Value
About This Home
This home is located at 1313 E Sahuaro Dr, Phoenix, AZ 85020 and is currently estimated at $411,427, approximately $247 per square foot. 1313 E Sahuaro Dr is a home located in Maricopa County with nearby schools including Larkspur Elementary School, Shea Middle School, and Shadow Mountain High School.
Ownership History
Date
Name
Owned For
Owner Type
Purchase Details
Closed on
May 3, 2005
Sold by
Spangler Lucy A Woodcock and Spangler Lavoy E
Bought by
Spangler Lavoy E and Spangler Lucy A Woodcock
Current Estimated Value
Home Financials for this Owner
Home Financials are based on the most recent Mortgage that was taken out on this home.
Original Mortgage
$164,000
Outstanding Balance
$86,497
Interest Rate
6.02%
Mortgage Type
New Conventional
Estimated Equity
$324,930
Purchase Details
Closed on
Jun 28, 2002
Sold by
Burckle Lucy and Burckle Lucy A
Bought by
Woodcock Lucy
Home Financials for this Owner
Home Financials are based on the most recent Mortgage that was taken out on this home.
Original Mortgage
$74,000
Interest Rate
6.71%
Purchase Details
Closed on
Mar 19, 1998
Sold by
Burckle Lucy
Bought by
Woodcock Lucy
Purchase Details
Closed on
Oct 21, 1996
Sold by
Burckle Charles Gregory
Bought by
Burckle Lucy
Create a Home Valuation Report for This Property
The Home Valuation Report is an in-depth analysis detailing your home's value as well as a comparison with similar homes in the area
Home Values in the Area
Average Home Value in this Area
Purchase History
| Date | Buyer | Sale Price | Title Company |
|---|---|---|---|
| Spangler Lavoy E | -- | -- | |
| Woodcock Lucy | -- | -- | |
| Woodcock Lucy | -- | -- | |
| Burckle Lucy | -- | -- |
Source: Public Records
Mortgage History
| Date | Status | Borrower | Loan Amount |
|---|---|---|---|
| Open | Spangler Lavoy E | $164,000 | |
| Closed | Woodcock Lucy | $74,000 |
Source: Public Records
Tax History
| Year | Tax Paid | Tax Assessment Tax Assessment Total Assessment is a certain percentage of the fair market value that is determined by local assessors to be the total taxable value of land and additions on the property. | Land | Improvement |
|---|---|---|---|---|
| 2025 | $1,170 | $13,516 | -- | -- |
| 2024 | $1,114 | $12,872 | -- | -- |
| 2023 | $1,114 | $28,320 | $5,660 | $22,660 |
| 2022 | $1,104 | $22,050 | $4,410 | $17,640 |
| 2021 | $1,122 | $19,350 | $3,870 | $15,480 |
| 2020 | $1,084 | $17,880 | $3,570 | $14,310 |
| 2019 | $1,089 | $14,560 | $2,910 | $11,650 |
| 2018 | $1,049 | $12,980 | $2,590 | $10,390 |
| 2017 | $671 | $11,220 | $2,240 | $8,980 |
| 2016 | $660 | $10,680 | $2,130 | $8,550 |
| 2015 | $612 | $9,750 | $1,950 | $7,800 |
Source: Public Records
Map
Nearby Homes
- 1317 E Sahuaro Dr
- 1307 E Sahuaro Dr
- 1314 E Becker Ln
- 1308 E Becker Ln
- 1318 E Becker Ln
- 1323 E Sahuaro Dr
- 1314 E Sahuaro Dr
- 1318 E Sahuaro Dr
- 1308 E Sahuaro Dr
- 1302 E Becker Ln
- 1324 E Becker Ln
- 1324 E Sahuaro Dr
- 1245 E Sahuaro Dr
- 1302 E Sahuaro Dr
- 1329 E Sahuaro Dr
- 1246 E Becker Ln
- 1330 E Becker Ln
- 1330 E Sahuaro Dr
- 1246 E Sahuaro Dr
- 1313 E Christy Dr
Your Personal Tour Guide
Ask me questions while you tour the home.