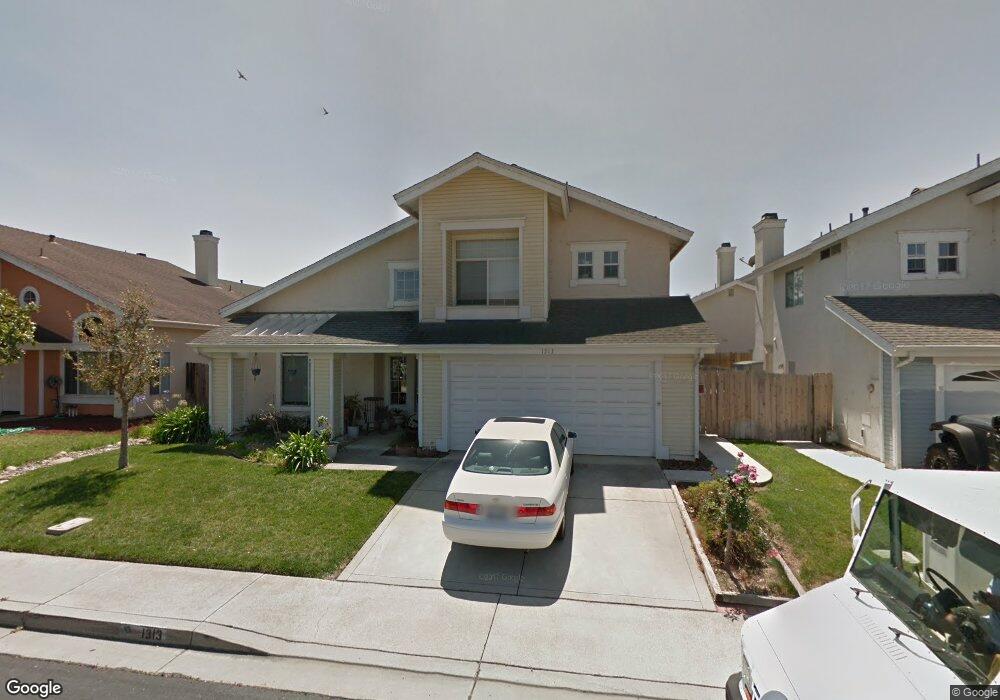
1313 Glen Ellen Ln Lompoc, CA 93436
Estimated Value: $582,411 - $636,000
3
Beds
3
Baths
1,626
Sq Ft
$376/Sq Ft
Est. Value
About This Home
This home is located at 1313 Glen Ellen Ln, Lompoc, CA 93436 and is currently estimated at $611,603, approximately $376 per square foot. 1313 Glen Ellen Ln is a home located in Santa Barbara County with nearby schools including La Canada Elementary School, Lompoc Valley Middle School, and Lompoc High School.
Ownership History
Date
Name
Owned For
Owner Type
Purchase Details
Closed on
Jan 11, 2016
Sold by
Newman Robert
Bought by
Alfonso David and Alfonso Jacqueline M
Current Estimated Value
Home Financials for this Owner
Home Financials are based on the most recent Mortgage that was taken out on this home.
Original Mortgage
$325,858
Interest Rate
3.72%
Mortgage Type
VA
Purchase Details
Closed on
Jul 29, 2002
Sold by
Davis James Mitchell and Reis Davis Ana M
Bought by
Newman Robert
Home Financials for this Owner
Home Financials are based on the most recent Mortgage that was taken out on this home.
Original Mortgage
$45,736
Interest Rate
6.51%
Mortgage Type
Credit Line Revolving
Purchase Details
Closed on
Sep 15, 1995
Sold by
Fl Lompoc Venture
Bought by
Davis James M and Reis Davis Ana M
Home Financials for this Owner
Home Financials are based on the most recent Mortgage that was taken out on this home.
Original Mortgage
$155,113
Interest Rate
7.42%
Mortgage Type
FHA
Create a Home Valuation Report for This Property
The Home Valuation Report is an in-depth analysis detailing your home's value as well as a comparison with similar homes in the area
Home Values in the Area
Average Home Value in this Area
Purchase History
| Date | Buyer | Sale Price | Title Company |
|---|---|---|---|
| Alfonso David | $319,000 | Stewart Title Of Ca Inc | |
| Newman Robert | $305,000 | First American Title | |
| Davis James M | $159,000 | First American Title |
Source: Public Records
Mortgage History
| Date | Status | Borrower | Loan Amount |
|---|---|---|---|
| Previous Owner | Alfonso David | $325,858 | |
| Previous Owner | Newman Robert | $45,736 | |
| Previous Owner | Newman Robert | $243,919 | |
| Previous Owner | Davis James M | $155,113 |
Source: Public Records
Tax History
| Year | Tax Paid | Tax Assessment Tax Assessment Total Assessment is a certain percentage of the fair market value that is determined by local assessors to be the total taxable value of land and additions on the property. | Land | Improvement |
|---|---|---|---|---|
| 2025 | $2,255 | $377,622 | $142,051 | $235,571 |
| 2023 | $2,255 | $362,960 | $136,536 | $226,424 |
| 2022 | $2,364 | $355,844 | $133,859 | $221,985 |
| 2021 | $4,096 | $348,868 | $131,235 | $217,633 |
| 2020 | $4,052 | $345,292 | $129,890 | $215,402 |
| 2019 | $3,986 | $338,523 | $127,344 | $211,179 |
| 2018 | $3,925 | $331,887 | $124,848 | $207,039 |
| 2017 | $3,853 | $325,380 | $122,400 | $202,980 |
| 2016 | $3,702 | $319,000 | $120,000 | $199,000 |
| 2015 | $3,139 | $269,000 | $119,000 | $150,000 |
| 2014 | $3,001 | $256,000 | $113,000 | $143,000 |
Source: Public Records
Map
Nearby Homes
- 1212 Timothy Ct
- 1344 Village Meadows Dr
- 1416 Glen Ellen Ln
- 1213 Iris Ct
- 933 Bellflower Ln
- 908 Northpoint Place
- 1249 Westbrook Dr
- 1012 W Anthony Way
- 2000 Green Ridge Cir
- 1103 Point Sal Loop
- 321 W North Ave Unit 133
- 2205 Point Sal Loop
- 1407 N H St
- 100 California 1
- 600 N Y St
- 516 N U St
- 420 N W St
- 526 N L St
- 510 N I St
- 321 N Z St
- 1317 Glen Ellen Ln
- 1309 Glen Ellen Ln
- 1317 Glen Ellen Ct
- 1308 Jodi Dr
- 1321 Glen Ellen Ct
- 1321 Glen Ellen Ln
- 1304 Jodi Dr
- 1305 Glen Ellen Ln
- 1316 Jodi Dr
- 1316 Glen Ellen Ln
- 1329 Glen Ellen Ln
- 1325 Glen Ellen Ct
- 1300 Jodi Dr
- 1320 Glen Ellen Ln
- 1224 W Barton Ave
- 1220 W Barton Ave
- 1304 W Barton Ave
- 1313 Jodi Dr
- 1324 Glen Ellen Ln
Your Personal Tour Guide
Ask me questions while you tour the home.