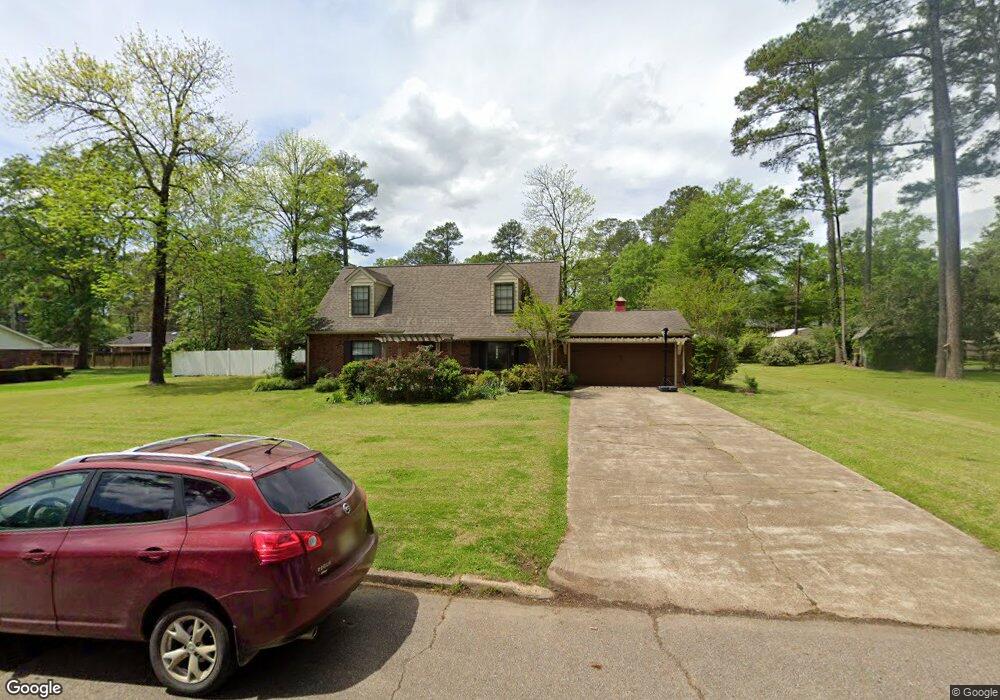
1313 Mapleview Rd West Point, MS 39773
Estimated Value: $236,000 - $255,000
2
Beds
--
Bath
2,610
Sq Ft
$93/Sq Ft
Est. Value
About This Home
This home is located at 1313 Mapleview Rd, West Point, MS 39773 and is currently estimated at $243,818, approximately $93 per square foot. 1313 Mapleview Rd is a home located in Clay County with nearby schools including East Side Elementary School, West Clay Elementary School, and Church Hill Elementary School.
Ownership History
Date
Name
Owned For
Owner Type
Purchase Details
Closed on
Nov 22, 2021
Sold by
Brasfield Monte G
Bought by
Tirey Brandon Neil and Tirey Sheri Lynn
Current Estimated Value
Purchase Details
Closed on
Dec 19, 2006
Sold by
Swoope James P and Swoope Jennifer
Bought by
Brasfield Monte G and Brasfield Suzzanne B
Home Financials for this Owner
Home Financials are based on the most recent Mortgage that was taken out on this home.
Original Mortgage
$148,000
Interest Rate
6.19%
Create a Home Valuation Report for This Property
The Home Valuation Report is an in-depth analysis detailing your home's value as well as a comparison with similar homes in the area
Purchase History
| Date | Buyer | Sale Price | Title Company |
|---|---|---|---|
| Tirey Brandon Neil | -- | None Listed On Document | |
| Brasfield Monte G | -- | -- |
Source: Public Records
Mortgage History
| Date | Status | Borrower | Loan Amount |
|---|---|---|---|
| Previous Owner | Brasfield Monte G | $148,000 |
Source: Public Records
Tax History
| Year | Tax Paid | Tax Assessment Tax Assessment Total Assessment is a certain percentage of the fair market value that is determined by local assessors to be the total taxable value of land and additions on the property. | Land | Improvement |
|---|---|---|---|---|
| 2025 | $971 | $20,672 | $2,500 | $18,172 |
| 2024 | $971 | $20,672 | $2,500 | $18,172 |
| 2023 | $2,294 | $17,331 | $2,500 | $14,831 |
| 2022 | $795 | $17,331 | $2,500 | $14,831 |
| 2021 | $792 | $17,331 | $2,500 | $14,831 |
| 2020 | $792 | $17,331 | $2,500 | $14,831 |
| 2019 | $734 | $17,107 | $2,500 | $14,607 |
| 2018 | $697 | $17,107 | $2,500 | $14,607 |
| 2017 | $697 | $17,107 | $2,500 | $14,607 |
| 2016 | $665 | $17,107 | $2,500 | $14,607 |
| 2015 | $623 | $15,676 | $2,500 | $13,176 |
| 2014 | $524 | $15,676 | $2,500 | $13,176 |
| 2013 | $524 | $15,676 | $2,500 | $13,176 |
Source: Public Records
Map
Nearby Homes
- 161 Mapleview Rd
- 264 Mapleview Rd
- 389 Mapleview Rd
- Lot 2 Waverly Rd
- Lot 6 Waverly Rd
- Lot 5 Waverly Rd
- Lot 3 Waverly Rd
- Lot 10 Waverly Rd
- Lot 8 Waverly Rd
- Lot 7 Waverly Rd
- Lot 9 Waverly Rd
- Lot 4 Waverly Rd
- Lot 11 Waverly Rd
- 15 David St
- 3986 E Church Hill Rd
- 44 Torbert Dr
- 405 S Eshman Ave
- 1046 E Brame Ave
- 472 S Eshman Ave
- 507 S Eshman Ave
- 1307 Mapleview Rd
- 1328 Pinewood Rd
- 121 Mapleview Rd
- 1316 Mapleview Rd
- 1444 Pinewood Rd
- 1306 Mapleview Rd
- 1306 Mapleview Rd
- 1341 Pinewood Rd
- 1401 Sycamore Dr
- 1334 Mapleview Rd
- 1400 Pinewood Rd
- 1333 Mapleview Rd
- 219 Mapleview Rd
- 1405 Pinewood Rd
- 1314 Mapleview Rd
- 1449 Pinewood Rd
- 1344 Mapleview Rd
- 66 Mapleview Rd
- 1236 Mapleview Rd
- 1343 Mapleview Rd
Your Personal Tour Guide
Ask me questions while you tour the home.