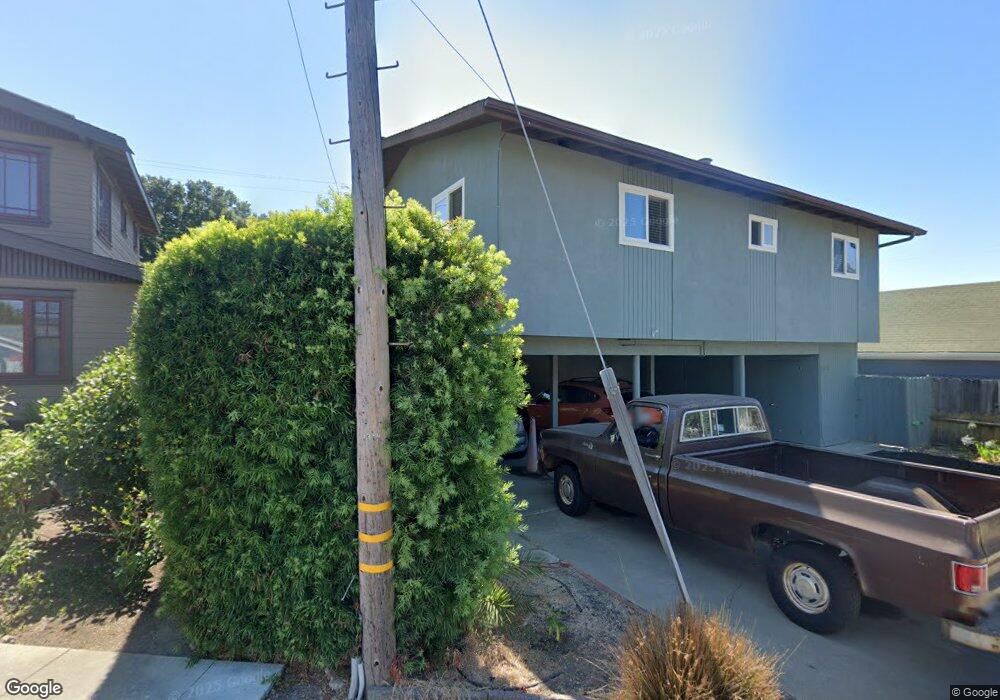
1313 Peach St Unit 1-3 San Luis Obispo, CA 93401
Downtown San Luis Obispo NeighborhoodEstimated Value: $1,054,000 - $1,399,000
6
Beds
3
Baths
1,452
Sq Ft
$896/Sq Ft
Est. Value
About This Home
This home is located at 1313 Peach St Unit 1-3, San Luis Obispo, CA 93401 and is currently estimated at $1,300,315, approximately $895 per square foot. 1313 Peach St Unit 1-3 is a home located in San Luis Obispo County with nearby schools including Laguna Middle School, San Luis Obispo High School, and San Luis Obispo Classical Academy.
Ownership History
Date
Name
Owned For
Owner Type
Purchase Details
Closed on
Feb 2, 2001
Sold by
Woodworth Donald E and Weir Mitzi
Bought by
Morton Bruce Cameron and Morton Dana Lynn
Current Estimated Value
Home Financials for this Owner
Home Financials are based on the most recent Mortgage that was taken out on this home.
Original Mortgage
$303,750
Outstanding Balance
$108,898
Interest Rate
6.98%
Estimated Equity
$1,191,417
Create a Home Valuation Report for This Property
The Home Valuation Report is an in-depth analysis detailing your home's value as well as a comparison with similar homes in the area
Home Values in the Area
Average Home Value in this Area
Purchase History
| Date | Buyer | Sale Price | Title Company |
|---|---|---|---|
| Morton Bruce Cameron | $405,000 | Fidelity National Title Co |
Source: Public Records
Mortgage History
| Date | Status | Borrower | Loan Amount |
|---|---|---|---|
| Open | Morton Bruce Cameron | $303,750 |
Source: Public Records
Tax History Compared to Growth
Tax History
| Year | Tax Paid | Tax Assessment Tax Assessment Total Assessment is a certain percentage of the fair market value that is determined by local assessors to be the total taxable value of land and additions on the property. | Land | Improvement |
|---|---|---|---|---|
| 2025 | $7,138 | $610,250 | $226,015 | $384,235 |
| 2024 | $7,018 | $598,285 | $221,584 | $376,701 |
| 2023 | $7,018 | $586,555 | $217,240 | $369,315 |
| 2022 | $6,592 | $575,055 | $212,981 | $362,074 |
| 2021 | $6,458 | $563,780 | $208,805 | $354,975 |
| 2020 | $6,390 | $558,000 | $206,664 | $351,336 |
| 2019 | $6,312 | $547,060 | $202,612 | $344,448 |
| 2018 | $6,197 | $536,335 | $198,640 | $337,695 |
| 2017 | $6,073 | $525,820 | $194,746 | $331,074 |
| 2016 | $5,830 | $515,511 | $190,928 | $324,583 |
| 2015 | $5,443 | $507,769 | $188,061 | $319,708 |
| 2014 | $5,149 | $497,824 | $184,378 | $313,446 |
Source: Public Records
Map
Nearby Homes
- 1318 Mill St
- 879 Johnson Ave
- 1229 Mill St
- 1214 Mill St
- 779 Toro St
- 787 Toro St
- 783 Toro St
- 1308 Monterey St Unit 340
- 1143 Walnut St
- 551 Hathway Ave
- 623 Grove St
- 879 Walnut St
- 1213 Murray Ave
- 441 Kentucky St
- 680 Chorro St Unit 5
- 680 Chorro St Unit 18
- 670 Chorro St Unit D
- 1263 Pismo St
- 311 Longview Ln
- 364 Hathway Ave