
Seller's Agent in 2025
Austin Stage
A+ Realty, LLC
(605) 228-4087
156 in this area
185 Total Sales
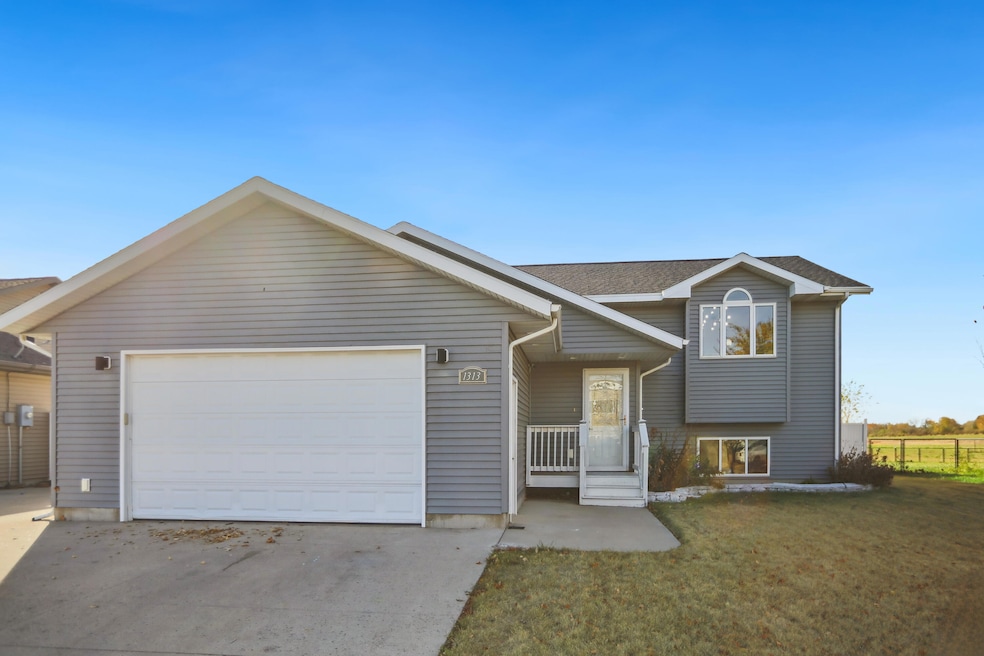


You are going to love this quality built 2009 Alliance construction home. Some TLC may be needed to polish this home into a diamond! Check out this property before its GONE. Motivated Seller!
Home Type
Single Family
Year Built
2009
Lot Details
0.3 Acres
| Date | Type | Sale Price | Title Company |
|---|---|---|---|
| Warranty Deed | $211,600 | None Available |
| Date | Status | Loan Amount | Loan Type |
|---|---|---|---|
| Open | $204,133 | FHA |
| Date | Event | Price | List to Sale | Price per Sq Ft | Prior Sale |
|---|---|---|---|---|---|
| 05/27/2025 05/27/25 | Sold | $300,000 | -2.1% | $133 / Sq Ft | |
| 04/02/2025 04/02/25 | Off Market | $306,500 | -- | -- | |
| 03/26/2025 03/26/25 | Price Changed | $306,500 | -5.7% | $136 / Sq Ft | |
| 01/17/2025 01/17/25 | Price Changed | $325,000 | -3.6% | $145 / Sq Ft | |
| 10/31/2024 10/31/24 | For Sale | $337,000 | +19.5% | $150 / Sq Ft | |
| 06/27/2022 06/27/22 | Sold | $282,000 | +34.3% | $125 / Sq Ft | View Prior Sale |
| 05/03/2022 05/03/22 | Pending | -- | -- | -- | |
| 04/13/2015 04/13/15 | Sold | $210,000 | -- | $93 / Sq Ft | View Prior Sale |
| 02/19/2015 02/19/15 | Pending | -- | -- | -- |
| Year | Tax Paid | Tax Assessment Tax Assessment Total Assessment is a certain percentage of the fair market value that is determined by local assessors to be the total taxable value of land and additions on the property. | Land | Improvement |
|---|---|---|---|---|
| 2025 | $4,637 | $300,913 | $25,991 | $274,922 |
| 2024 | $4,579 | $279,598 | $25,627 | $253,971 |
| 2023 | $4,241 | $253,987 | $25,627 | $228,360 |
| 2022 | $3,866 | $223,643 | $25,161 | $198,482 |
| 2021 | $3,788 | $217,240 | $25,161 | $192,079 |
| 2020 | $3,673 | $210,843 | $25,161 | $185,682 |
| 2019 | $3,722 | $207,060 | $21,378 | $185,682 |
| 2018 | $3,489 | $207,060 | $21,378 | $185,682 |
| 2017 | -- | $201,755 | $21,378 | $180,377 |
| 2016 | -- | $198,218 | $0 | $198,218 |
| 2015 | -- | $194,681 | $0 | $194,681 |
| 2014 | -- | $203,160 | $0 | $203,160 |
| 2011 | -- | $197,257 | $0 | $0 |
Seller's Agent in 2025
Austin Stage
A+ Realty, LLC
(605) 228-4087
156 in this area
185 Total Sales
Source: Aberdeen Area Association of REALTORS®
MLS Number: 24-868
APN: 25464
Ask me questions while you tour the home.