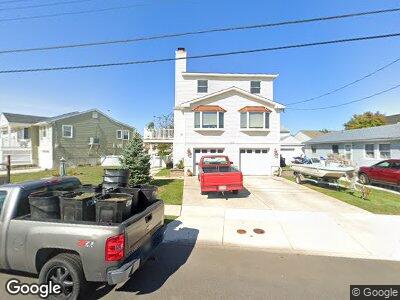
1313 Sheridan Blvd Brigantine, NJ 08203
Estimated Value: $569,283 - $652,000
3
Beds
1
Bath
1,008
Sq Ft
$597/Sq Ft
Est. Value
About This Home
This home is located at 1313 Sheridan Blvd, Brigantine, NJ 08203 and is currently estimated at $601,321, approximately $596 per square foot. 1313 Sheridan Blvd is a home located in Atlantic County with nearby schools including Brigantine Elementary School and Brigantine Community School.
Ownership History
Date
Name
Owned For
Owner Type
Purchase Details
Closed on
Jun 26, 2012
Sold by
Miller Carol Jerrahian and Miller Gary Gerard
Bought by
Cordivari James D
Current Estimated Value
Home Financials for this Owner
Home Financials are based on the most recent Mortgage that was taken out on this home.
Original Mortgage
$180,500
Interest Rate
3.59%
Mortgage Type
New Conventional
Purchase Details
Closed on
Jul 16, 2004
Sold by
Jerrahian Carol and Miller Carol Jerrahian
Bought by
Miller Gary Gerard and Miller Carol Jerrahian
Purchase Details
Closed on
Feb 25, 2003
Sold by
Kumkumian Barbara
Bought by
Jerrahian Carol
Home Financials for this Owner
Home Financials are based on the most recent Mortgage that was taken out on this home.
Original Mortgage
$150,000
Interest Rate
5.94%
Mortgage Type
Credit Line Revolving
Purchase Details
Closed on
Oct 24, 1988
Sold by
Jerrahian Carol and Jerrahian Robert A
Bought by
Jerrahian Carol
Create a Home Valuation Report for This Property
The Home Valuation Report is an in-depth analysis detailing your home's value as well as a comparison with similar homes in the area
Home Values in the Area
Average Home Value in this Area
Purchase History
| Date | Buyer | Sale Price | Title Company |
|---|---|---|---|
| Cordivari James D | $190,000 | Chicago Title | |
| Miller Gary Gerard | -- | Commonwealth Land Title Insu | |
| Jerrahian Carol | -- | -- | |
| Jerrahian Carol | -- | Commonwealth Land Title Ins | |
| Jerrahian Carol | -- | -- |
Source: Public Records
Mortgage History
| Date | Status | Borrower | Loan Amount |
|---|---|---|---|
| Previous Owner | Cordivari James D | $180,500 | |
| Previous Owner | Jerrahian Carol | $150,000 |
Source: Public Records
Tax History Compared to Growth
Tax History
| Year | Tax Paid | Tax Assessment Tax Assessment Total Assessment is a certain percentage of the fair market value that is determined by local assessors to be the total taxable value of land and additions on the property. | Land | Improvement |
|---|---|---|---|---|
| 2024 | $5,339 | $284,000 | $157,400 | $126,600 |
| 2023 | $4,933 | $284,000 | $157,400 | $126,600 |
| 2022 | $4,933 | $284,000 | $157,400 | $126,600 |
| 2021 | $4,845 | $284,000 | $157,400 | $126,600 |
| 2020 | $4,794 | $284,000 | $157,400 | $126,600 |
| 2019 | $4,837 | $284,000 | $157,400 | $126,600 |
| 2018 | $4,933 | $284,000 | $157,400 | $126,600 |
| 2017 | $5,013 | $284,000 | $157,400 | $126,600 |
| 2016 | $5,010 | $284,000 | $157,400 | $126,600 |
| 2015 | $5,035 | $191,400 | $157,400 | $34,000 |
| 2014 | $3,267 | $191,400 | $157,400 | $34,000 |
Source: Public Records
Map
Nearby Homes
- 1300 Duncan Place
- 1311 Duncan Place
- 29 Cummings Place
- 17 Vardon Rd
- 5 Collette Cir
- 16 Collette Cir
- 506 Lafayette Blvd
- 554 W Shore Dr
- 510 W Shore Dr
- 1507 Sheridan Blvd
- 703 Bobby Jones Rd
- 926 N Shore Dr
- 702 Sterling Place
- 18 Macdonald Place
- 817 Lafayette Blvd
- 819 Lafayette Blvd
- 1040 N Shore Dr
- 444 W Shore Dr Unit 1
- 466 W Shore Dr
- 714 Sheridan Blvd
- 1313 Sheridan Blvd
- 1311 Sheridan Blvd
- 1315 Sheridan Blvd
- 1310 Duncan Place
- 1309 Sheridan Blvd
- 1308 Duncan Place
- 603 Sarazen Rd
- 1306 Duncan Place
- 1307 Sheridan Blvd
- 1310 Sheridan Blvd
- 1304 Duncan Place
- 1308 Sheridan Blvd
- 1305 Sheridan Blvd
- 1306 Sheridan Blvd
- 1302 Duncan Place
- 1401 Sheridan Blvd
- 1400 Sheridan Blvd
- 1309 Duncan Place
- 1313 Duncan Place
- 1303 Sheridan Blvd