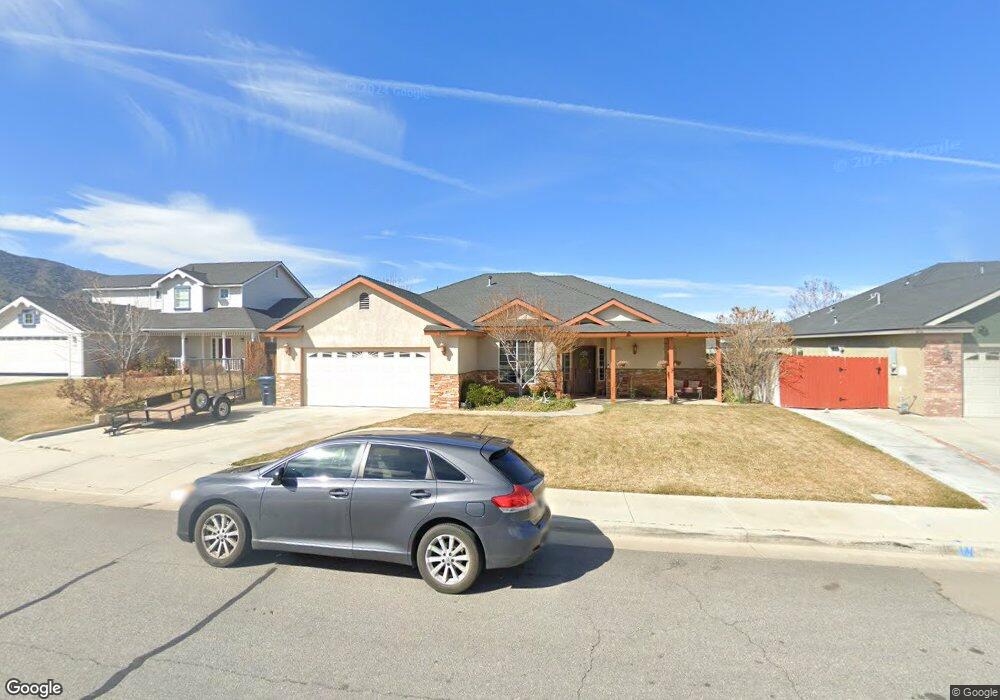
1313 Tara Ct Tehachapi, CA 93561
Estimated Value: $446,014 - $522,000
3
Beds
2
Baths
1,730
Sq Ft
$281/Sq Ft
Est. Value
About This Home
This home is located at 1313 Tara Ct, Tehachapi, CA 93561 and is currently estimated at $486,004, approximately $280 per square foot. 1313 Tara Ct is a home located in Kern County with nearby schools including Tompkins Elementary School, Jacobsen Middle School, and Tehachapi High School.
Ownership History
Date
Name
Owned For
Owner Type
Purchase Details
Closed on
May 21, 2025
Sold by
Schmidt Cody J
Bought by
Schmidt Amanda C
Current Estimated Value
Home Financials for this Owner
Home Financials are based on the most recent Mortgage that was taken out on this home.
Original Mortgage
$282,500
Interest Rate
6.26%
Mortgage Type
New Conventional
Purchase Details
Closed on
Feb 16, 2010
Sold by
Federal Home Loan Mortgage Corporation
Bought by
Schmidt Cody J and Schmidt Amanda C
Home Financials for this Owner
Home Financials are based on the most recent Mortgage that was taken out on this home.
Original Mortgage
$234,179
Interest Rate
5%
Mortgage Type
FHA
Purchase Details
Closed on
Dec 2, 2009
Sold by
Lopez Mario and Aragon Francine
Bought by
Federal Home Loan Mortgage Corporation
Purchase Details
Closed on
Oct 18, 2006
Sold by
William Beirne Construction Inc
Bought by
Lopez Mario and Aragon Francine
Home Financials for this Owner
Home Financials are based on the most recent Mortgage that was taken out on this home.
Original Mortgage
$265,680
Interest Rate
7.87%
Mortgage Type
Purchase Money Mortgage
Create a Home Valuation Report for This Property
The Home Valuation Report is an in-depth analysis detailing your home's value as well as a comparison with similar homes in the area
Home Values in the Area
Average Home Value in this Area
Purchase History
| Date | Buyer | Sale Price | Title Company |
|---|---|---|---|
| Schmidt Amanda C | -- | Chicago Title Company | |
| Schmidt Cody J | $238,500 | First American Title Ins Co | |
| Federal Home Loan Mortgage Corporation | $201,000 | Landsafe Title | |
| Lopez Mario | $332,500 | Alliance Title Company |
Source: Public Records
Mortgage History
| Date | Status | Borrower | Loan Amount |
|---|---|---|---|
| Previous Owner | Schmidt Amanda C | $282,500 | |
| Previous Owner | Schmidt Cody J | $234,179 | |
| Previous Owner | Lopez Mario | $265,680 |
Source: Public Records
Tax History
| Year | Tax Paid | Tax Assessment Tax Assessment Total Assessment is a certain percentage of the fair market value that is determined by local assessors to be the total taxable value of land and additions on the property. | Land | Improvement |
|---|---|---|---|---|
| 2025 | $3,991 | $307,846 | $51,627 | $256,219 |
| 2024 | $3,852 | $301,811 | $50,615 | $251,196 |
| 2023 | $3,852 | $295,894 | $49,623 | $246,271 |
| 2022 | $3,810 | $290,093 | $48,650 | $241,443 |
| 2021 | $3,770 | $284,406 | $47,697 | $236,709 |
| 2020 | $3,778 | $281,490 | $47,208 | $234,282 |
| 2019 | $3,769 | $281,490 | $47,208 | $234,282 |
| 2018 | $3,638 | $270,562 | $45,376 | $225,186 |
| 2017 | $3,520 | $257,000 | $64,000 | $193,000 |
| 2016 | $3,307 | $242,000 | $61,000 | $181,000 |
| 2015 | $3,171 | $240,000 | $60,000 | $180,000 |
| 2014 | $2,758 | $204,000 | $51,000 | $153,000 |
Source: Public Records
Map
Nearby Homes
- 109 Oak Place
- 403 Mesquite Dr
- 1219 Catalpa Ct
- 260 Pinon St
- 1331 S Green St
- 1320 El Rancho Dr
- 504 Mesquite Dr
- 23860 El Rancho Dr
- 114 Chaparrel St
- 1438 Wild Olive Rd
- 0 Fir St
- 0 Pinon St
- 1013 Cypress Way
- 1360 Bodega Dr
- 210 Pinon St Unit 11
- 210 Pinon St Unit 18
- 210 Pinon St Unit 4
- 210 Pinon St Unit 1
- 210 Pinon St Unit 6
- 210 Pinon St Unit 15
- 1307 Tara Ct
- 1315 Tara Ct
- 1312 Scarlet Oak Dr Unit A
- 1308 Scarlet Oak Dr Unit A
- 1316 Scarlet Oak Dr
- 1303 Tara Ct
- 1312 Tara Ct
- 1317 Tara Ct Unit B
- 1304 Scarlet Oak Dr Unit A
- 1306 Tara Ct
- 1314 Tara Ct
- 1318 Tara Ct
- 1301 Tara Ct
- 1304 Tara Ct
- 1316 Tara Ct
- 1300 Scarlet Oak Dr Unit A
- 1324 Scarlet Oak Dr
- 1307 Fair Oak Dr
- 1300 Tara Ct
- 1305 Fair Oak Dr
Your Personal Tour Guide
Ask me questions while you tour the home.