Estimated Value: $334,508 - $344,000
4
Beds
2
Baths
2,120
Sq Ft
$160/Sq Ft
Est. Value
About This Home
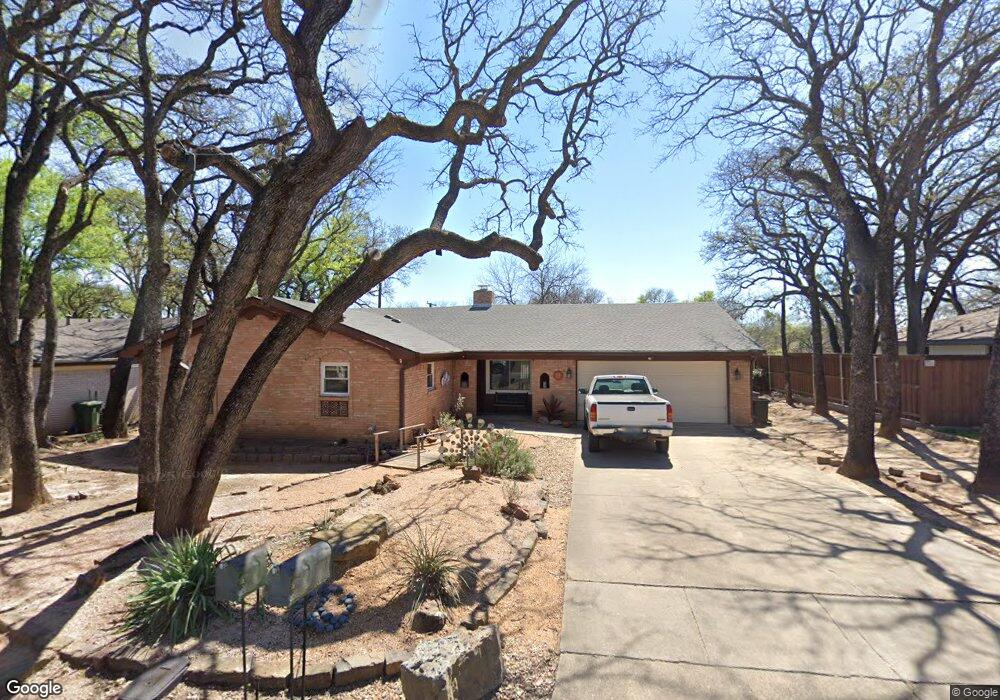
This home is located at 1313 W Redbud Dr, Hurst, TX 76053 and is currently estimated at $339,627, approximately $160 per square foot. 1313 W Redbud Dr is a home located in Tarrant County with nearby schools including Hurst Hills Elementary School, Hurst J High School, and L.D. Bell High School.
Ownership History
Date
Name
Owned For
Owner Type
Purchase Details
Closed on
Feb 10, 2011
Sold by
Mccurdy Mary Mae and Meredith Misty Charisse
Bought by
Fitzgerald Erin M
Current Estimated Value
Home Financials for this Owner
Home Financials are based on the most recent Mortgage that was taken out on this home.
Original Mortgage
$107,257
Outstanding Balance
$73,672
Interest Rate
4.86%
Mortgage Type
VA
Estimated Equity
$265,955
Purchase Details
Closed on
Feb 7, 2011
Sold by
Mccurdy James and Antwiler Margaret
Bought by
Meredith Misty Charisse
Home Financials for this Owner
Home Financials are based on the most recent Mortgage that was taken out on this home.
Original Mortgage
$107,257
Outstanding Balance
$73,672
Interest Rate
4.86%
Mortgage Type
VA
Estimated Equity
$265,955
Purchase Details
Closed on
Mar 24, 2006
Sold by
Lemay Mary Mae
Bought by
Meredith Misty Charisse
Create a Home Valuation Report for This Property
The Home Valuation Report is an in-depth analysis detailing your home's value as well as a comparison with similar homes in the area
Home Values in the Area
Average Home Value in this Area
Purchase History
| Date | Buyer | Sale Price | Title Company |
|---|---|---|---|
| Fitzgerald Erin M | $98,868 | Providence Title | |
| Meredith Misty Charisse | -- | Providence Title | |
| Meredith Misty Charisse | -- | None Available |
Source: Public Records
Mortgage History
| Date | Status | Borrower | Loan Amount |
|---|---|---|---|
| Open | Fitzgerald Erin M | $107,257 |
Source: Public Records
Tax History Compared to Growth
Tax History
| Year | Tax Paid | Tax Assessment Tax Assessment Total Assessment is a certain percentage of the fair market value that is determined by local assessors to be the total taxable value of land and additions on the property. | Land | Improvement |
|---|---|---|---|---|
| 2025 | $3,342 | $235,910 | $65,750 | $170,160 |
| 2024 | $3,342 | $235,910 | $65,750 | $170,160 |
| 2023 | $4,675 | $241,537 | $54,600 | $186,937 |
| 2022 | $4,884 | $214,601 | $54,612 | $159,989 |
| 2021 | $4,651 | $192,845 | $50,000 | $142,845 |
| 2020 | $4,923 | $222,272 | $50,000 | $172,272 |
| 2019 | $4,553 | $232,592 | $50,000 | $182,592 |
| 2018 | $3,561 | $169,104 | $25,000 | $144,104 |
| 2017 | $3,890 | $181,932 | $25,000 | $156,932 |
| 2016 | $3,537 | $176,147 | $25,000 | $151,147 |
| 2015 | $2,614 | $134,200 | $20,000 | $114,200 |
| 2014 | $2,614 | $134,200 | $20,000 | $114,200 |
Source: Public Records
Map
Nearby Homes
- 1304 W Redbud Dr
- 1361 Kathryn Ct
- 228 Arcadia St
- 632 Melbourne Ct
- 1200 Walker Dr
- 405 Billy Creek Cir
- 512 Billie Ruth Ln
- 1112 Blakey Ct
- 649 Timberline Dr
- 7601 Kevin Dr
- 4209 Ashmore Dr
- 3629 Landy Ln
- 4304 Lynn Terrace
- 8308 Fall Crest Dr
- 913 Zelda Dr
- 8105 Winter Falls Trail
- 7801 Conn Dr
- 425 Moore Creek Rd
- 916 Zelda Dr
- 1000 Madrid St
- 1317 W Redbud Dr
- 1309 W Redbud Dr
- 1321 W Redbud Dr
- 1305 W Redbud Dr
- 1308 W Redbud Dr
- 1312 W Redbud Dr
- 1325 W Redbud Dr
- 1316 W Redbud Dr
- 1301 W Redbud Dr
- 1300 W Redbud Dr
- 417 Arcadia St
- 1320 W Redbud Dr
- 1329 W Redbud Dr
- 505 Arcadia St
- 1324 W Redbud Dr
- 413 Arcadia St
- 1309 Kathryn St
- 1313 Kathryn St
- 509 Arcadia St
- 1317 Kathryn St