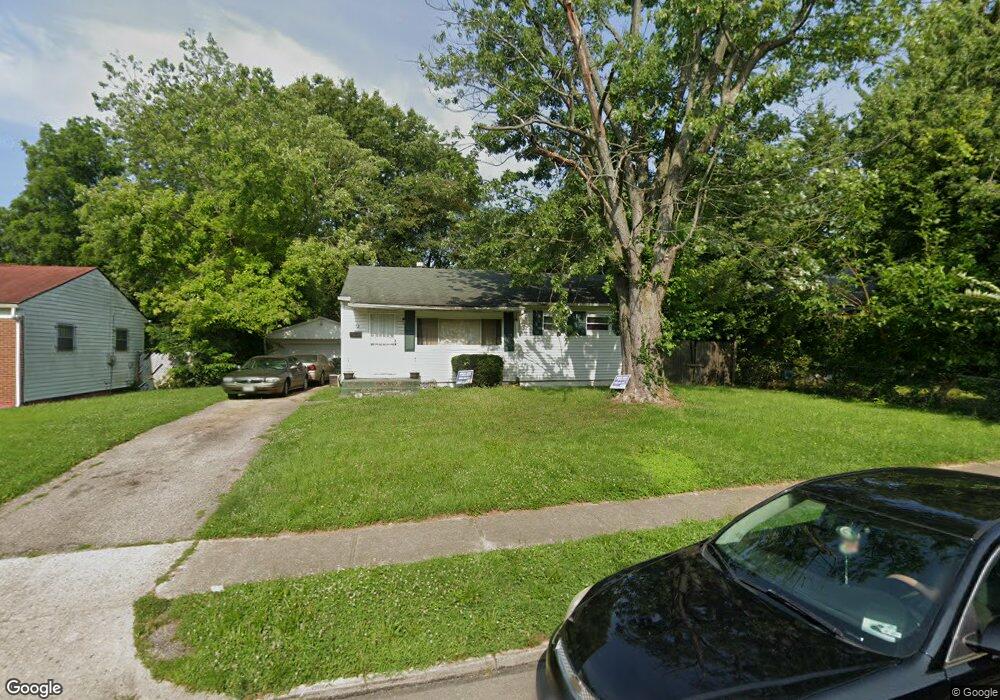
1313 Wesleyan Rd Dayton, OH 45406
Cornell Heights NeighborhoodEstimated Value: $68,000 - $82,000
3
Beds
1
Bath
864
Sq Ft
$90/Sq Ft
Est. Value
About This Home
This home is located at 1313 Wesleyan Rd, Dayton, OH 45406 and is currently estimated at $77,361, approximately $89 per square foot. 1313 Wesleyan Rd is a home located in Montgomery County with nearby schools including Valerie Elementary School, Dayton Leadership Academies, and Gem City Career Prep High School.
Ownership History
Date
Name
Owned For
Owner Type
Purchase Details
Closed on
Apr 30, 2012
Sold by
Dick Kama L and Dick David A
Bought by
Peterson Kimberly L
Current Estimated Value
Home Financials for this Owner
Home Financials are based on the most recent Mortgage that was taken out on this home.
Original Mortgage
$19,920
Outstanding Balance
$13,704
Interest Rate
3.75%
Mortgage Type
Assumption
Estimated Equity
$63,657
Purchase Details
Closed on
Jan 5, 2009
Sold by
Hsbc Bank Usa National Association
Bought by
Dick Kama L
Purchase Details
Closed on
Sep 16, 2008
Sold by
Wall Jeffrey
Bought by
Hsbc Bank Usa National Association
Purchase Details
Closed on
Mar 25, 2005
Sold by
Hinton Sheltisa and Hinton Kanekka
Bought by
Wall Jeffrey
Purchase Details
Closed on
Sep 21, 2004
Sold by
Ruchman Marshall D and Hinton Sheltisa
Bought by
Hinton Sheltisa and Hinton Kanekka
Create a Home Valuation Report for This Property
The Home Valuation Report is an in-depth analysis detailing your home's value as well as a comparison with similar homes in the area
Home Values in the Area
Average Home Value in this Area
Purchase History
| Date | Buyer | Sale Price | Title Company |
|---|---|---|---|
| Peterson Kimberly L | $24,900 | None Available | |
| Dick Kama L | $2,900 | Accutitle Agency Inc | |
| Hsbc Bank Usa National Association | $26,000 | None Available | |
| Wall Jeffrey | $9,000 | Vta Title Agency Inc | |
| Hinton Sheltisa | -- | None Available |
Source: Public Records
Mortgage History
| Date | Status | Borrower | Loan Amount |
|---|---|---|---|
| Open | Peterson Kimberly L | $19,920 |
Source: Public Records
Tax History Compared to Growth
Tax History
| Year | Tax Paid | Tax Assessment Tax Assessment Total Assessment is a certain percentage of the fair market value that is determined by local assessors to be the total taxable value of land and additions on the property. | Land | Improvement |
|---|---|---|---|---|
| 2024 | $769 | $13,450 | $4,140 | $9,310 |
| 2023 | $769 | $13,450 | $4,140 | $9,310 |
| 2022 | $849 | $11,510 | $3,540 | $7,970 |
| 2021 | $844 | $11,510 | $3,540 | $7,970 |
| 2020 | $841 | $11,510 | $3,540 | $7,970 |
| 2019 | $980 | $12,060 | $4,170 | $7,890 |
| 2018 | $982 | $12,060 | $4,170 | $7,890 |
| 2017 | $974 | $12,060 | $4,170 | $7,890 |
| 2016 | $1,093 | $12,930 | $4,170 | $8,760 |
| 2015 | $1,034 | $12,930 | $4,170 | $8,760 |
| 2014 | $1,034 | $12,930 | $4,170 | $8,760 |
| 2012 | -- | $14,800 | $5,010 | $9,790 |
Source: Public Records
Map
Nearby Homes
- 1365 Alcott Dr
- 1251 Canfield Ave
- 1460 Kipling Dr
- 936 Walton Ave
- 1641 Kipling Dr
- 3007 Cornell Dr
- 1419 Lexington Ave
- 3637 Stanford Place Unit 3631
- 3644 Karwin Dr Unit 3638
- 3108 Campus Dr
- 1045 Philadelphia Dr
- 1627 Harold Dr Unit 1621
- 733 Leland Ave
- 728 Leland Ave
- 24 Edith St
- 1656 Tennyson Ave
- 3231 Harvard Blvd
- 1124 Seneca Dr
- 1676 Tennyson Ave
- 1643 Earlham Dr
- 1321 Wesleyan Rd
- 1305 Wesleyan Rd
- 1327 Wesleyan Rd
- 1320 Wesleyan Rd
- 1314 Wesleyan Rd
- 1333 Wesleyan Rd
- 1326 Wesleyan Rd
- 1308 Wesleyan Rd
- 1330 Wesleyan Rd
- 1302 Wesleyan Rd
- 1339 Wesleyan Rd
- 1334 Wesleyan Rd
- 1338 Wesleyan Rd
- 3423 W Riverview Ave
- 1345 Wesleyan Rd
- 1331 Kingsley Ave
- 1335 Kingsley Ave
- 1327 Kingsley Ave
- 1339 Kingsley Ave
- 1343 Kingsley Ave