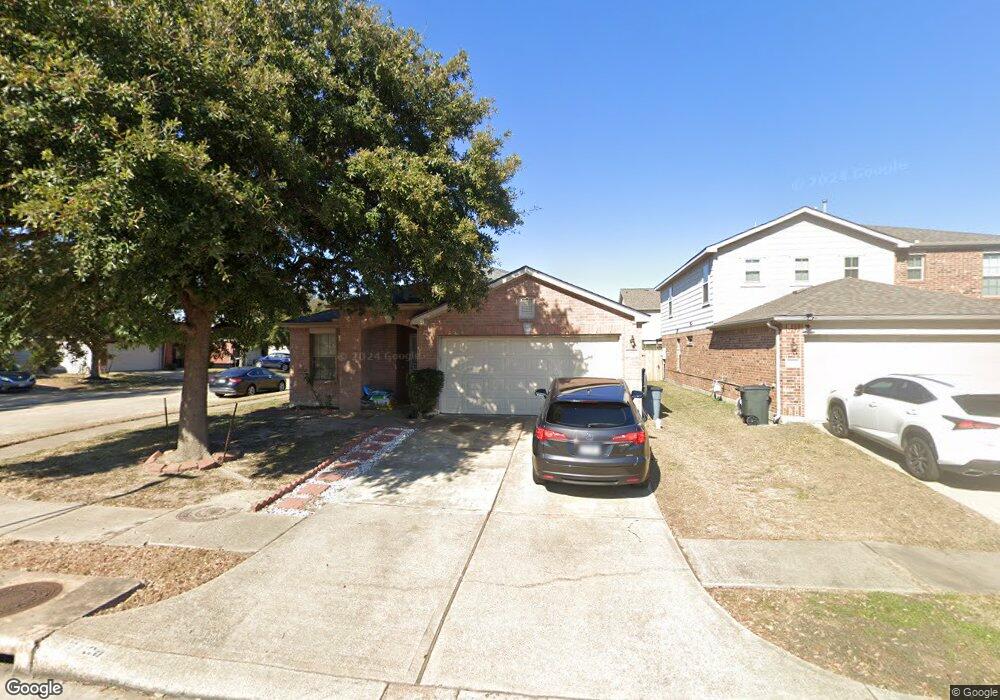
13130 Crescent Manor Ln Houston, TX 77072
Alief NeighborhoodEstimated Value: $259,000 - $274,000
3
Beds
2
Baths
1,811
Sq Ft
$147/Sq Ft
Est. Value
About This Home
This home is located at 13130 Crescent Manor Ln, Houston, TX 77072 and is currently estimated at $265,888, approximately $146 per square foot. 13130 Crescent Manor Ln is a home located in Harris County with nearby schools including Alexander Elementary School, Youngblood Intermediate School, and Holub Middle School.
Ownership History
Date
Name
Owned For
Owner Type
Purchase Details
Closed on
Jul 26, 2013
Sold by
Fannie Mae
Bought by
Nguyen Thuan V and Nguyen Tuyet Mai T
Current Estimated Value
Home Financials for this Owner
Home Financials are based on the most recent Mortgage that was taken out on this home.
Original Mortgage
$110,953
Outstanding Balance
$80,769
Interest Rate
3.87%
Mortgage Type
FHA
Estimated Equity
$185,119
Purchase Details
Closed on
Jan 13, 2011
Sold by
Onewest Bank Fsb
Bought by
Federal National Mortgage Association
Purchase Details
Closed on
Jan 4, 2011
Sold by
Truong Cuong and Bach Lieu
Bought by
Onewest Bank Fsb
Purchase Details
Closed on
Oct 21, 2005
Sold by
Kb Home Lone Star Lp
Bought by
Bach Lieu and Truong Cuong N
Home Financials for this Owner
Home Financials are based on the most recent Mortgage that was taken out on this home.
Original Mortgage
$111,196
Interest Rate
5.75%
Mortgage Type
Fannie Mae Freddie Mac
Create a Home Valuation Report for This Property
The Home Valuation Report is an in-depth analysis detailing your home's value as well as a comparison with similar homes in the area
Home Values in the Area
Average Home Value in this Area
Purchase History
| Date | Buyer | Sale Price | Title Company |
|---|---|---|---|
| Nguyen Thuan V | -- | None Available | |
| Federal National Mortgage Association | -- | None Available | |
| Onewest Bank Fsb | $114,775 | None Available | |
| Bach Lieu | -- | First American Title |
Source: Public Records
Mortgage History
| Date | Status | Borrower | Loan Amount |
|---|---|---|---|
| Open | Nguyen Thuan V | $110,953 | |
| Previous Owner | Bach Lieu | $111,196 |
Source: Public Records
Tax History Compared to Growth
Tax History
| Year | Tax Paid | Tax Assessment Tax Assessment Total Assessment is a certain percentage of the fair market value that is determined by local assessors to be the total taxable value of land and additions on the property. | Land | Improvement |
|---|---|---|---|---|
| 2025 | $4,443 | $272,715 | $49,605 | $223,110 |
| 2024 | $4,443 | $272,782 | $49,605 | $223,177 |
| 2023 | $4,443 | $261,342 | $49,605 | $211,737 |
| 2022 | $5,197 | $247,356 | $44,645 | $202,711 |
| 2021 | $4,770 | $190,249 | $37,204 | $153,045 |
| 2020 | $4,757 | $185,982 | $32,243 | $153,739 |
| 2019 | $4,609 | $177,310 | $27,283 | $150,027 |
| 2018 | $1,663 | $150,000 | $27,283 | $122,717 |
| 2017 | $4,175 | $150,000 | $27,283 | $122,717 |
| 2016 | $4,111 | $153,000 | $27,283 | $125,717 |
| 2015 | $3,297 | $144,656 | $27,283 | $117,373 |
| 2014 | $3,297 | $122,065 | $27,283 | $94,782 |
Source: Public Records
Map
Nearby Homes
- 13102 Lima Dr
- 13034 Lima Dr
- 8427 Brickhaven Ln
- 13426 Sanderford Ln
- 13122 Stratford Skies Ln
- 8110 Singing Sonnet Ln
- 8042 Montague Manor Ln
- 8115 Barnes Ridge Ln
- 8910 Beau Monde Dr
- 13103 Cressida Glen Ln
- 7930 Montague Manor Ln
- 13122 Cressida Glen Ln
- 13047 Lawsons Creek Ln
- 12722 Yoshino Cherry St
- 8602 Pottinger Dr
- 13150 Lawsons Creek Ln
- 8526 Ralstons Ridge Dr
- 8806 Inglebrook Ln
- 9219 Benchley Dr
- 8603 Jubilee Dr
- 13126 Crescent Manor Ln
- 13122 Crescent Manor Ln
- 13131 Dawn Hollow Ln
- 13127 Dawn Hollow Ln
- 8518 Village Rose Ln
- 8531 Village Rose Ln
- 8514 Village Rose Ln
- 13118 Crescent Manor Ln
- 13123 Dawn Hollow Ln
- 8522 Village Rose Ln
- 8510 Village Rose Ln
- 8526 Village Rose Ln
- 13119 Dawn Hollow Ln
- 8535 Village Rose Ln
- 8506 Village Rose Ln
- 13114 Crescent Manor Ln
- 8502 Bloom Mist Ct
- 8530 Village Rose Ln
- 13115 Dawn Hollow Ln
- 8502 Village Rose Ln