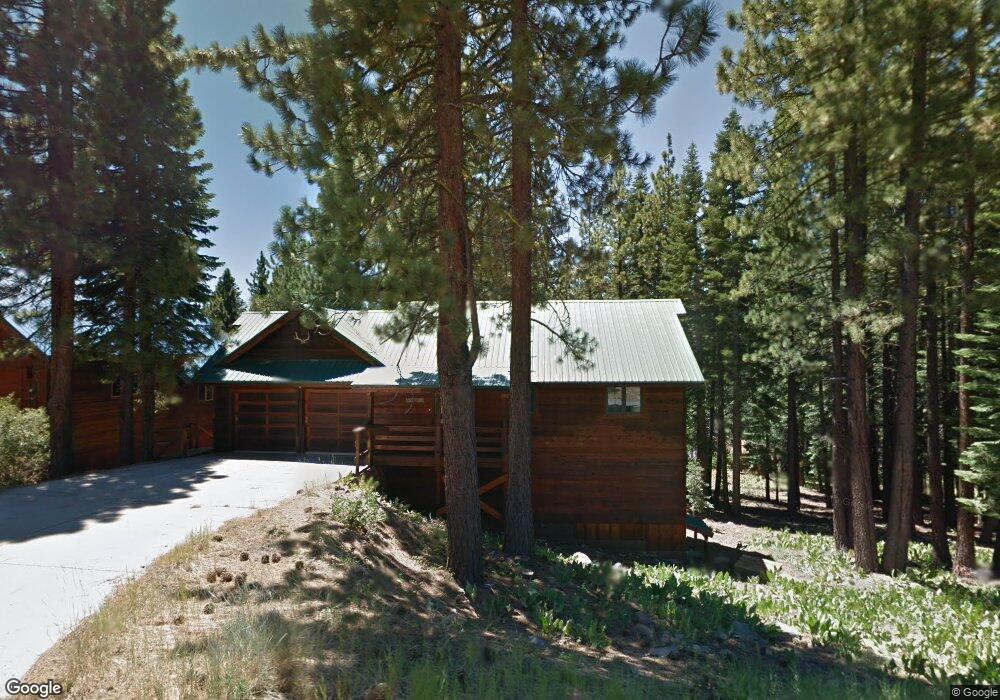
13130 Muhlebach Way Truckee, CA 96161
Tahoe Donner NeighborhoodEstimated Value: $844,000 - $925,000
2
Beds
2
Baths
1,511
Sq Ft
$586/Sq Ft
Est. Value
About This Home
This home is located at 13130 Muhlebach Way, Truckee, CA 96161 and is currently estimated at $884,793, approximately $585 per square foot. 13130 Muhlebach Way is a home located in Nevada County with nearby schools including Truckee Elementary School, Alder Creek Middle School, and Tahoe Truckee High School.
Ownership History
Date
Name
Owned For
Owner Type
Purchase Details
Closed on
Aug 11, 2024
Sold by
Katherine Severin Living Trust and Severin Katherine M
Bought by
Hart Daniel and Hart Adrienne
Current Estimated Value
Home Financials for this Owner
Home Financials are based on the most recent Mortgage that was taken out on this home.
Original Mortgage
$588,000
Outstanding Balance
$581,448
Interest Rate
6.95%
Mortgage Type
New Conventional
Estimated Equity
$303,345
Purchase Details
Closed on
Nov 14, 2020
Sold by
Severin Katherine M
Bought by
Severin Katherine M and The Katherine Severin Living T
Purchase Details
Closed on
Nov 10, 2015
Sold by
Connor Denton E
Bought by
Severin Katherine M
Purchase Details
Closed on
Jun 29, 1998
Sold by
Rieschel Donald R and Rieschel Linda B
Bought by
Connor Denton E and Severin Katherine M
Home Financials for this Owner
Home Financials are based on the most recent Mortgage that was taken out on this home.
Original Mortgage
$100,000
Interest Rate
7.06%
Create a Home Valuation Report for This Property
The Home Valuation Report is an in-depth analysis detailing your home's value as well as a comparison with similar homes in the area
Home Values in the Area
Average Home Value in this Area
Purchase History
| Date | Buyer | Sale Price | Title Company |
|---|---|---|---|
| Hart Daniel | $840,000 | First American Title | |
| Severin Katherine M | -- | None Available | |
| Severin Katherine M | -- | None Available | |
| Connor Denton E | $180,000 | Placer Title Company |
Source: Public Records
Mortgage History
| Date | Status | Borrower | Loan Amount |
|---|---|---|---|
| Open | Hart Daniel | $588,000 | |
| Previous Owner | Connor Denton E | $100,000 |
Source: Public Records
Tax History Compared to Growth
Tax History
| Year | Tax Paid | Tax Assessment Tax Assessment Total Assessment is a certain percentage of the fair market value that is determined by local assessors to be the total taxable value of land and additions on the property. | Land | Improvement |
|---|---|---|---|---|
| 2025 | $4,599 | $840,000 | $165,000 | $675,000 |
| 2024 | $4,500 | $279,576 | $55,190 | $224,386 |
| 2023 | $4,500 | $274,095 | $54,108 | $219,987 |
| 2022 | $4,321 | $268,722 | $53,048 | $215,674 |
| 2021 | $4,037 | $263,395 | $51,949 | $211,446 |
| 2020 | $3,998 | $260,695 | $51,417 | $209,278 |
| 2019 | $3,967 | $255,584 | $50,409 | $205,175 |
| 2018 | $3,511 | $250,573 | $49,421 | $201,152 |
| 2017 | $3,406 | $245,664 | $48,456 | $197,208 |
| 2016 | $3,361 | $240,079 | $46,737 | $193,342 |
| 2015 | $3,365 | $236,475 | $46,037 | $190,438 |
| 2014 | -- | $231,845 | $45,137 | $186,708 |
Source: Public Records
Map
Nearby Homes
- 12471 Northwoods Blvd Unit 1
- 12972 Muhlebach Way
- 14191 Hansel Ave
- 12765 Northwoods Blvd
- 12611 Muhlebach Way
- 12799 Northwoods Blvd Unit 2
- 12804 Northwoods Blvd Unit 441
- 11781 Chamonix Rd
- 12705 Falcon Point Place
- 11511 Baden Rd
- 13441 Cristallina Way
- 11964 Saint Bernard Dr
- 13485 Cristallina Way
- 13673 Hansel Ave
- 11665 Zermatt Dr
- 13075 Northwoods Blvd
- 17249 Northwoods Blvd
- 11554 Saint Bernard Dr
- 16465 Northwoods Blvd
- 13239 Northwoods Blvd Unit B
- 13116 Muhlebach Way
- 13141 Muhlebach Way
- 13131 Muhlebach Way
- 13100 Muhlebach Way
- 13160 Muhlebach Way
- 13216 Falcon Point Place
- 13101 Muhlebach Way
- 13161 Muhlebach Way
- 13178 Muhlebach Way
- 13117 Muhlebach Way
- 13200 Falcon Point Place
- 13151 Muhlebach Way
- 13182 Falcon Point Place Unit 2
- 13088 Muhlebach Way
- 13166 Falcon Point Place
- 13066 Muhlebach Way
- 13087 Muhlebach Way
- 13232 Falcon Point Place
- 13196 Muhlebach Way
- 13150 Falcon Point Place