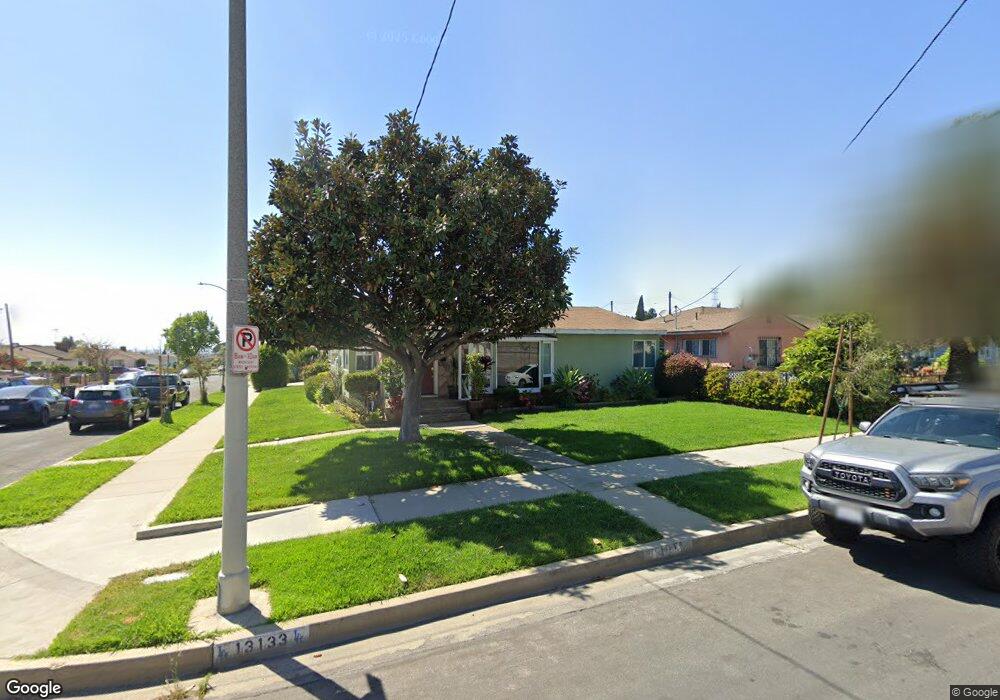
13133 S Hoover St Gardena, CA 90247
Harbor Gateway NeighborhoodEstimated Value: $672,000 - $792,000
2
Beds
1
Bath
1,467
Sq Ft
$498/Sq Ft
Est. Value
About This Home
This home is located at 13133 S Hoover St, Gardena, CA 90247 and is currently estimated at $730,210, approximately $497 per square foot. 13133 S Hoover St is a home located in Los Angeles County with nearby schools including One Hundred Thirty-Fifth Street Elementary School, Avalon Gardens Elementary School, and Purche Avenue Elementary School.
Ownership History
Date
Name
Owned For
Owner Type
Purchase Details
Closed on
Jan 9, 2012
Sold by
Aguilar Gilberto and Urias Rosa A
Bought by
Urias Rosa A
Current Estimated Value
Purchase Details
Closed on
Feb 15, 2002
Sold by
V R California Holdings Llc
Bought by
Aguilar Gilberto
Home Financials for this Owner
Home Financials are based on the most recent Mortgage that was taken out on this home.
Original Mortgage
$168,113
Outstanding Balance
$69,415
Interest Rate
7.04%
Estimated Equity
$660,795
Purchase Details
Closed on
Dec 11, 2001
Sold by
Gonzalez Miguel and Gonzalez Dolores
Bought by
Vr California Holdings Llc
Home Financials for this Owner
Home Financials are based on the most recent Mortgage that was taken out on this home.
Original Mortgage
$138,700
Interest Rate
6.57%
Purchase Details
Closed on
Sep 21, 2001
Sold by
Tran Hai Thanh and Tran Thuy Thi
Bought by
Gonzalez Miguel
Create a Home Valuation Report for This Property
The Home Valuation Report is an in-depth analysis detailing your home's value as well as a comparison with similar homes in the area
Home Values in the Area
Average Home Value in this Area
Purchase History
| Date | Buyer | Sale Price | Title Company |
|---|---|---|---|
| Urias Rosa A | -- | None Available | |
| Aguilar Gilberto | $187,000 | Fidelity Title | |
| Vr California Holdings Llc | $140,000 | Fidelity Title | |
| Gonzalez Miguel | $115,000 | Fidelity National Title |
Source: Public Records
Mortgage History
| Date | Status | Borrower | Loan Amount |
|---|---|---|---|
| Open | Aguilar Gilberto | $168,113 | |
| Previous Owner | Vr California Holdings Llc | $138,700 |
Source: Public Records
Tax History Compared to Growth
Tax History
| Year | Tax Paid | Tax Assessment Tax Assessment Total Assessment is a certain percentage of the fair market value that is determined by local assessors to be the total taxable value of land and additions on the property. | Land | Improvement |
|---|---|---|---|---|
| 2025 | $4,180 | $309,413 | $246,339 | $63,074 |
| 2024 | $4,180 | $303,347 | $241,509 | $61,838 |
| 2023 | $4,104 | $297,400 | $236,774 | $60,626 |
| 2022 | $3,926 | $291,570 | $232,132 | $59,438 |
| 2021 | $3,872 | $285,854 | $227,581 | $58,273 |
| 2019 | $3,762 | $277,378 | $220,832 | $56,546 |
| 2018 | $3,676 | $271,940 | $216,502 | $55,438 |
| 2016 | $3,505 | $261,382 | $208,096 | $53,286 |
| 2015 | $3,454 | $257,457 | $204,971 | $52,486 |
| 2014 | $3,468 | $252,414 | $200,956 | $51,458 |
Source: Public Records
Map
Nearby Homes
- 840 W 130th St
- 641 W 127th St
- 13713 S Vermont Ave Unit 24
- 13713 S Vermont Ave Unit 20
- 13713 S Vermont Ave Unit 15
- 13713 S Vermont Ave Unit 2
- 13031 S Catalina Ave
- 1125 W 129th St
- 13837 Emerald Ln
- 1048 W 125th St
- 801 W 124th St
- 14100 S Ainsworth St
- 13707 S Budlong Ave Unit 118
- 452 Laconia Blvd
- 12309 Arbor Place
- 14053 Spurlock Ln Unit 3
- 1122 W 124th St
- 1349 W 135th St Unit 21
- 13628 S Mariposa Ave
- 1261 139th St
- 13125 S Hoover St
- 13121 S Hoover St
- 13201 S Hoover St
- 721 W 132nd St
- 13115 S Hoover St
- 727 W 132nd St
- 13211 S Hoover St
- 722 W 132nd St
- 13111 S Hoover St
- 731 W 132nd St
- 13215 S Hoover St
- 726 W 132nd St
- 722 W 131st St
- 13105 S Hoover St
- 737 W 132nd St
- 726 W 131st St
- 732 W 132nd St
- 13221 S Hoover St
- 732 W 131st St
- 736 W 132nd St