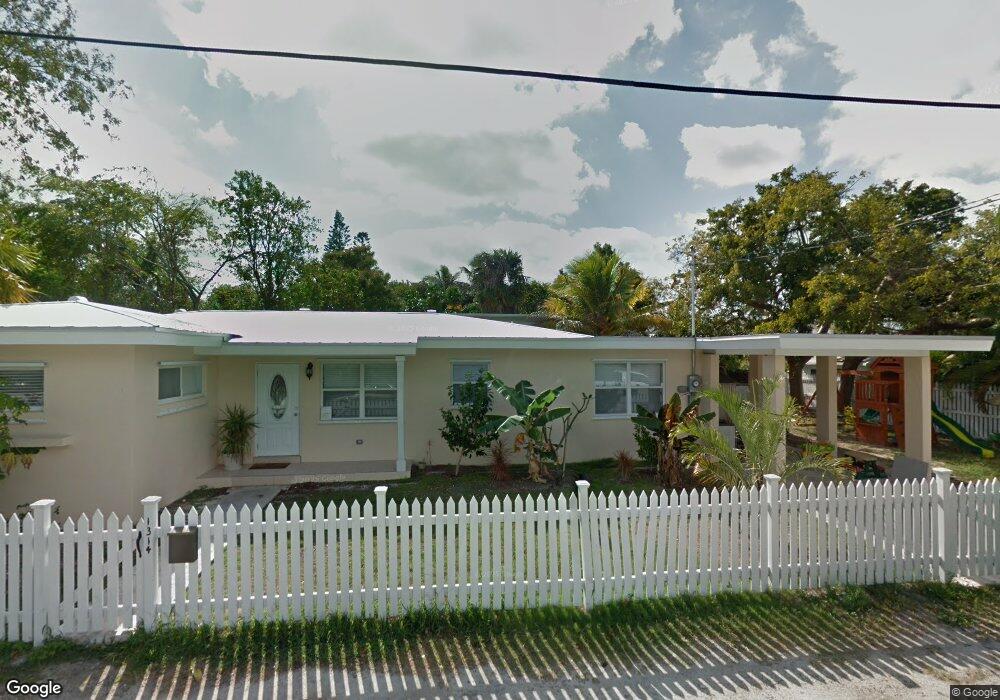
1314 10th St Key West, FL 33040
New Town NeighborhoodEstimated Value: $835,163 - $1,137,000
3
Beds
2
Baths
1,394
Sq Ft
$738/Sq Ft
Est. Value
About This Home
This home is located at 1314 10th St, Key West, FL 33040 and is currently estimated at $1,028,291, approximately $737 per square foot. 1314 10th St is a home located in Monroe County with nearby schools including Poinciana Elementary School, Key West High School, and May Sands Montessori School.
Ownership History
Date
Name
Owned For
Owner Type
Purchase Details
Closed on
Apr 5, 2024
Sold by
Bridger Julie A and Bridger Christopher S
Bought by
Bridger Julie A
Current Estimated Value
Purchase Details
Closed on
Oct 29, 2010
Sold by
Utsler Annette
Bought by
Bridger Christopher S and Bridger Julie A
Home Financials for this Owner
Home Financials are based on the most recent Mortgage that was taken out on this home.
Original Mortgage
$345,349
Interest Rate
4.33%
Mortgage Type
FHA
Purchase Details
Closed on
Apr 16, 2010
Sold by
Ellis Michael Dwayne
Bought by
Utsler Annette
Create a Home Valuation Report for This Property
The Home Valuation Report is an in-depth analysis detailing your home's value as well as a comparison with similar homes in the area
Home Values in the Area
Average Home Value in this Area
Purchase History
| Date | Buyer | Sale Price | Title Company |
|---|---|---|---|
| Bridger Julie A | -- | None Listed On Document | |
| Bridger Julie A | -- | None Listed On Document | |
| Bridger Christopher S | $350,000 | None Available | |
| Utsler Annette | $230,000 | Attorney |
Source: Public Records
Mortgage History
| Date | Status | Borrower | Loan Amount |
|---|---|---|---|
| Previous Owner | Bridger Christopher S | $345,349 |
Source: Public Records
Tax History
| Year | Tax Paid | Tax Assessment Tax Assessment Total Assessment is a certain percentage of the fair market value that is determined by local assessors to be the total taxable value of land and additions on the property. | Land | Improvement |
|---|---|---|---|---|
| 2025 | $2,905 | $350,783 | -- | -- |
| 2024 | $2,847 | $340,897 | -- | -- |
| 2023 | $2,847 | $330,968 | $0 | $0 |
| 2022 | $2,756 | $321,329 | $0 | $0 |
| 2021 | $2,804 | $311,970 | $0 | $0 |
| 2020 | $2,756 | $307,663 | $0 | $0 |
| 2019 | $2,712 | $300,746 | $0 | $0 |
| 2018 | $2,703 | $295,139 | $0 | $0 |
| 2017 | $2,687 | $289,069 | $0 | $0 |
| 2016 | $2,760 | $283,124 | $0 | $0 |
| 2015 | $2,814 | $281,156 | $0 | $0 |
| 2014 | $2,888 | $278,925 | $0 | $0 |
Source: Public Records
Map
Nearby Homes
- 2827 Staples Ave
- 2809 Flagler Ave
- 2828 Harris Ave
- 1406 Sunset Dr
- 2827 Harris Ave
- 2911 Seidenberg Ave
- 2914 Fogarty Ave
- 1417 8th St
- 2922 Flagler Ave
- 2928 Fogarty Ave
- 2926 Flagler Ave
- 1421 12th St
- 2924 Riviera Dr
- 3001 Riviera Dr
- 2521 Flagler Ave Unit 4
- 2524 Patterson Ave
- 3011 Riviera Dr
- 1613 Trinidad Dr
- 1620 Jamaica Dr
- 2322 Seidenberg Ave
- 2717 Seidenberg Ave
- 1326 10th St
- 2803 Seidenberg Ave
- 2804 Harris Ave
- 2711 Seidenberg Ave
- 2722 Seidenberg Ave
- 2718 Seidenberg Ave
- 2807 Seidenberg Ave
- 2804 Seidenberg Ave
- 2710 Harris Ave
- 2808 Harris Ave
- 2710 Seidenberg Ave
- 2808 Seidenberg Ave
- 2811 Seidenberg Ave
- 1335 Sunset Dr
- 1331 Sunset Dr
- 2737 Harris Ave
- 2812 Harris Ave
- 2721 Staples Ave
- 1341 Sunset Dr
Your Personal Tour Guide
Ask me questions while you tour the home.