Estimated Value: $84,000 - $331,000
--
Bed
1
Bath
2,040
Sq Ft
$120/Sq Ft
Est. Value
About This Home
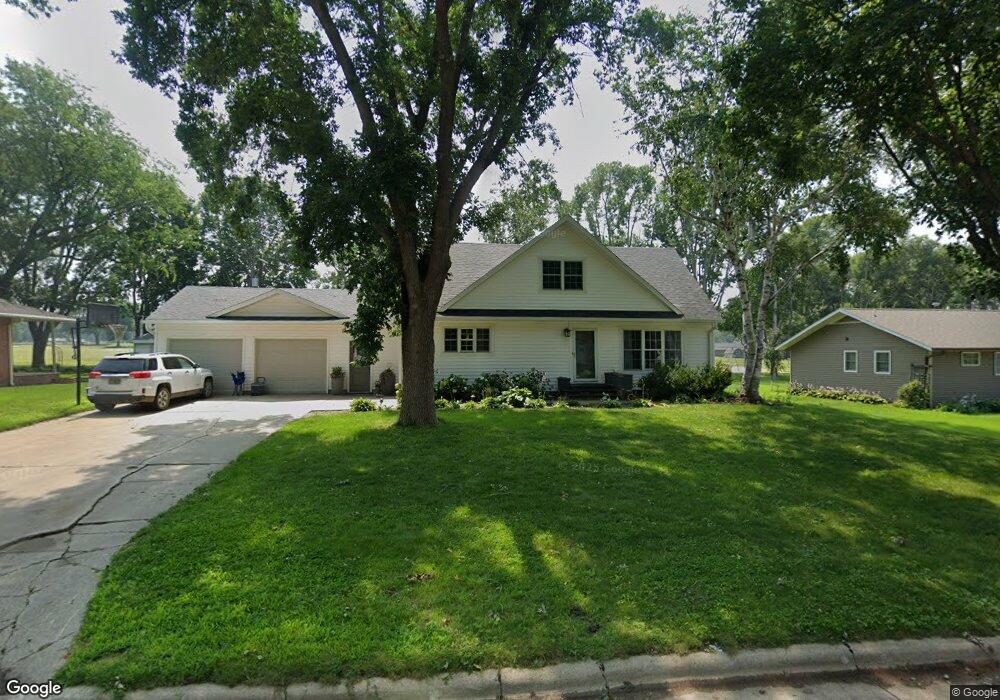
This home is located at 1314 6th St, Hull, IA 51239 and is currently estimated at $243,961, approximately $119 per square foot. 1314 6th St is a home located in Sioux County with nearby schools including Boyden-Hull Elementary School, Boyden-Hull High School, and Hull Christian School.
Ownership History
Date
Name
Owned For
Owner Type
Purchase Details
Closed on
May 22, 2014
Sold by
Deboef Steven and De Boef Lynn
Bought by
Vanmiddendorp Trevor and Van Middendorp Jennifer
Current Estimated Value
Home Financials for this Owner
Home Financials are based on the most recent Mortgage that was taken out on this home.
Original Mortgage
$155,000
Outstanding Balance
$117,907
Interest Rate
4.28%
Mortgage Type
New Conventional
Estimated Equity
$126,054
Create a Home Valuation Report for This Property
The Home Valuation Report is an in-depth analysis detailing your home's value as well as a comparison with similar homes in the area
Home Values in the Area
Average Home Value in this Area
Purchase History
| Date | Buyer | Sale Price | Title Company |
|---|---|---|---|
| Vanmiddendorp Trevor | $155,000 | None Available |
Source: Public Records
Mortgage History
| Date | Status | Borrower | Loan Amount |
|---|---|---|---|
| Open | Vanmiddendorp Trevor | $155,000 |
Source: Public Records
Tax History Compared to Growth
Tax History
| Year | Tax Paid | Tax Assessment Tax Assessment Total Assessment is a certain percentage of the fair market value that is determined by local assessors to be the total taxable value of land and additions on the property. | Land | Improvement |
|---|---|---|---|---|
| 2025 | $3,484 | $283,660 | $28,200 | $255,460 |
| 2024 | $3,484 | $239,720 | $28,200 | $211,520 |
| 2023 | $3,432 | $239,720 | $28,200 | $211,520 |
| 2022 | $3,358 | $202,960 | $28,200 | $174,760 |
| 2021 | $3,198 | $203,420 | $28,200 | $175,220 |
| 2020 | $3,198 | $184,650 | $28,200 | $156,450 |
| 2019 | $2,994 | $171,260 | $21,150 | $150,110 |
| 2018 | $3,052 | $171,260 | $21,150 | $150,110 |
| 2017 | $3,052 | $171,260 | $21,150 | $150,110 |
| 2014 | $2,882 | $163,770 | $0 | $0 |
Source: Public Records
Map
Nearby Homes