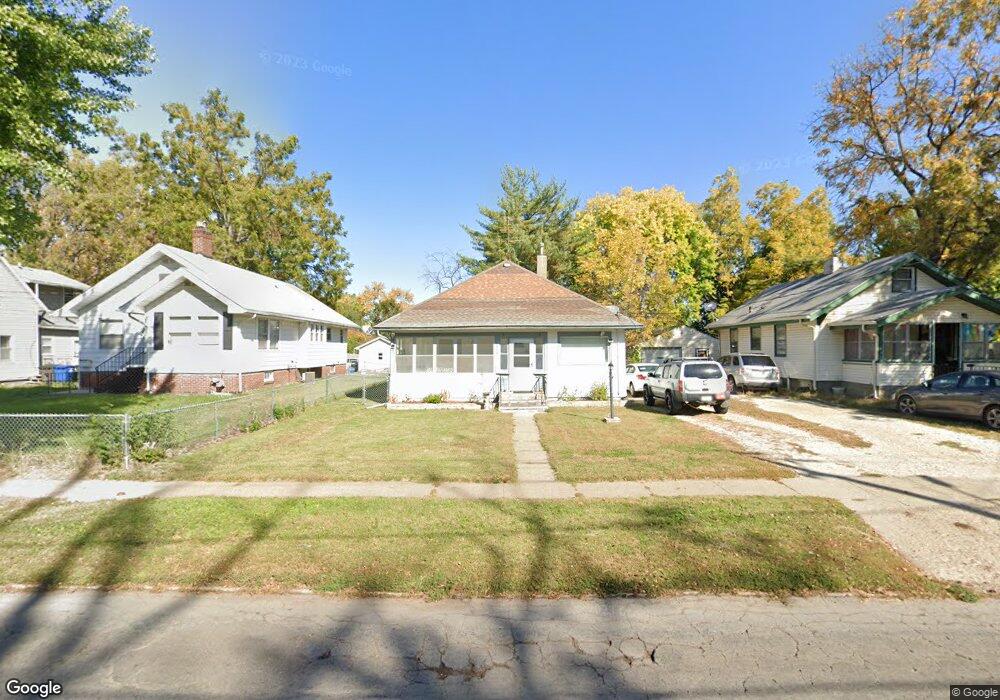
1314 Hull Ave Des Moines, IA 50316
Highland Park NeighborhoodEstimated Value: $148,000 - $159,000
2
Beds
1
Bath
930
Sq Ft
$166/Sq Ft
Est. Value
About This Home
This home is located at 1314 Hull Ave, Des Moines, IA 50316 and is currently estimated at $154,289, approximately $165 per square foot. 1314 Hull Ave is a home located in Polk County with nearby schools including Cattell Elementary School, Harding Middle School, and North High School.
Ownership History
Date
Name
Owned For
Owner Type
Purchase Details
Closed on
Dec 27, 2006
Sold by
Abc Properties Inc
Bought by
Cordero Clemente
Current Estimated Value
Home Financials for this Owner
Home Financials are based on the most recent Mortgage that was taken out on this home.
Original Mortgage
$67,900
Outstanding Balance
$40,438
Interest Rate
6.24%
Mortgage Type
Purchase Money Mortgage
Estimated Equity
$113,851
Create a Home Valuation Report for This Property
The Home Valuation Report is an in-depth analysis detailing your home's value as well as a comparison with similar homes in the area
Home Values in the Area
Average Home Value in this Area
Purchase History
| Date | Buyer | Sale Price | Title Company |
|---|---|---|---|
| Cordero Clemente | $67,500 | None Available |
Source: Public Records
Mortgage History
| Date | Status | Borrower | Loan Amount |
|---|---|---|---|
| Open | Cordero Clemente | $67,900 |
Source: Public Records
Tax History Compared to Growth
Tax History
| Year | Tax Paid | Tax Assessment Tax Assessment Total Assessment is a certain percentage of the fair market value that is determined by local assessors to be the total taxable value of land and additions on the property. | Land | Improvement |
|---|---|---|---|---|
| 2025 | $2,262 | $146,100 | $33,600 | $112,500 |
| 2024 | $2,262 | $125,500 | $28,800 | $96,700 |
| 2023 | $2,098 | $125,500 | $28,800 | $96,700 |
| 2022 | $2,080 | $97,900 | $23,200 | $74,700 |
| 2021 | $1,916 | $97,900 | $23,200 | $74,700 |
| 2020 | $1,986 | $85,400 | $20,400 | $65,000 |
| 2019 | $1,816 | $85,400 | $20,400 | $65,000 |
| 2018 | $1,792 | $76,100 | $18,100 | $58,000 |
| 2017 | $1,638 | $76,100 | $18,100 | $58,000 |
| 2016 | $1,592 | $69,100 | $16,200 | $52,900 |
| 2015 | $1,592 | $69,100 | $16,200 | $52,900 |
| 2014 | $1,460 | $65,900 | $15,400 | $50,500 |
Source: Public Records
Map
Nearby Homes