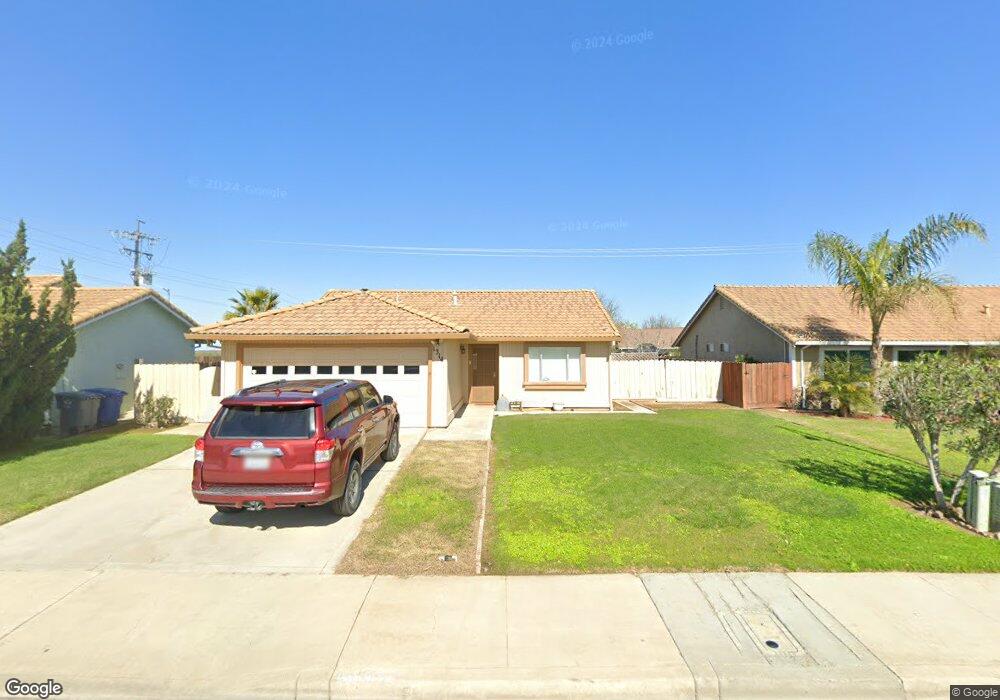
1314 Quail St Los Banos, CA 93635
Estimated Value: $307,000 - $365,000
2
Beds
2
Baths
1,002
Sq Ft
$342/Sq Ft
Est. Value
About This Home
This home is located at 1314 Quail St, Los Banos, CA 93635 and is currently estimated at $342,402, approximately $341 per square foot. 1314 Quail St is a home located in Merced County with nearby schools including Volta Elementary School, Los Banos Junior High School, and Pacheco High School.
Ownership History
Date
Name
Owned For
Owner Type
Purchase Details
Closed on
Jun 24, 2019
Sold by
Braya Shyliene E
Bought by
Braya Shyliene E
Current Estimated Value
Purchase Details
Closed on
Feb 3, 2003
Sold by
Silva Edward J and Silva Joan Denise
Bought by
Braya Shyliene E
Home Financials for this Owner
Home Financials are based on the most recent Mortgage that was taken out on this home.
Original Mortgage
$90,000
Outstanding Balance
$33,747
Interest Rate
4.25%
Mortgage Type
Purchase Money Mortgage
Estimated Equity
$308,655
Purchase Details
Closed on
Jun 11, 1997
Sold by
Lane Diane C and Lane Diane G
Bought by
Silva Edward J and Silva Denise Joan
Home Financials for this Owner
Home Financials are based on the most recent Mortgage that was taken out on this home.
Original Mortgage
$65,600
Interest Rate
6.85%
Mortgage Type
Purchase Money Mortgage
Create a Home Valuation Report for This Property
The Home Valuation Report is an in-depth analysis detailing your home's value as well as a comparison with similar homes in the area
Home Values in the Area
Average Home Value in this Area
Purchase History
| Date | Buyer | Sale Price | Title Company |
|---|---|---|---|
| Braya Shyliene E | -- | None Available | |
| Braya Shyliene E | $140,000 | Transcounty Title Company | |
| Silva Edward J | $82,000 | Fidelity National Title Co |
Source: Public Records
Mortgage History
| Date | Status | Borrower | Loan Amount |
|---|---|---|---|
| Open | Braya Shyliene E | $90,000 | |
| Previous Owner | Silva Edward J | $65,600 |
Source: Public Records
Tax History Compared to Growth
Tax History
| Year | Tax Paid | Tax Assessment Tax Assessment Total Assessment is a certain percentage of the fair market value that is determined by local assessors to be the total taxable value of land and additions on the property. | Land | Improvement |
|---|---|---|---|---|
| 2025 | $2,168 | $202,743 | $57,922 | $144,821 |
| 2024 | $2,168 | $198,769 | $56,787 | $141,982 |
| 2023 | $2,046 | $194,873 | $55,674 | $139,199 |
| 2022 | $2,014 | $191,053 | $54,583 | $136,470 |
| 2021 | $1,994 | $187,308 | $53,513 | $133,795 |
| 2020 | $1,971 | $185,389 | $52,965 | $132,424 |
| 2019 | $1,935 | $181,755 | $51,927 | $129,828 |
| 2018 | $1,876 | $178,192 | $50,909 | $127,283 |
| 2017 | $1,853 | $174,699 | $49,911 | $124,788 |
| 2016 | $1,873 | $171,275 | $48,933 | $122,342 |
| 2015 | $1,633 | $151,000 | $60,000 | $91,000 |
| 2014 | $1,183 | $112,000 | $30,000 | $82,000 |
Source: Public Records
Map
Nearby Homes
- 1338 Quail St
- 1349 Quail St
- 1406 Quail St
- 766 Meadowlark Ave
- 543 N Mercey Springs Rd
- 1364 Dove St
- 1347 Dove St
- 814 Del Rio Dr
- 675 Pinot Noir Ct
- 850 El Monte Ct
- 1537 Cardinal St
- 644 Mendocino Ct
- 1013 Chenin Blanc St
- 436 N Mercey Springs Rd Unit 69
- 436 N Mercey Springs Rd Unit 16
- 653 Stonewood Dr
- 1046 Santa Barbara St
- 510 Stonehaven Dr
- 1024 Walnutwood Ct
- 418 Rockport Dr
- 1318 Quail St
- 1310 Quail St
- 803 San Carlo Ln
- 1309 El Camino Way
- 1322 Quail St
- 755 Skylark Ave
- 1317 Quail St
- 1313 El Camino Way
- 1326 Quail St
- 807 San Carlo Ln
- 1321 Quail St
- 749 Skylark Ave
- 1317 El Camino Way
- 1330 Quail St
- 1325 Quail St
- 1316 Chukar St
- 811 San Carlo Ln
- 814 San Carlo Ln
- 1321 El Camino Way
- 745 Skylark Ave