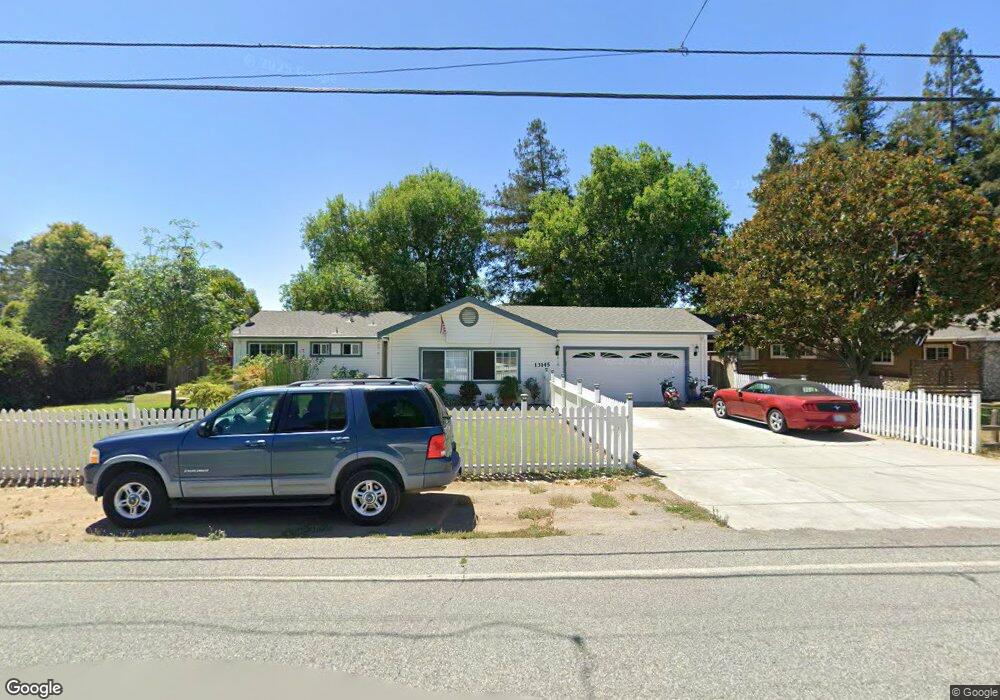
13145 Llagas Ave San Martin, CA 95046
Estimated Value: $1,137,778 - $1,532,000
3
Beds
2
Baths
1,688
Sq Ft
$792/Sq Ft
Est. Value
About This Home
This home is located at 13145 Llagas Ave, San Martin, CA 95046 and is currently estimated at $1,336,945, approximately $792 per square foot. 13145 Llagas Ave is a home located in Santa Clara County with nearby schools including San Martin/Gwinn Environmental Science Academy, Britton Middle School, and Live Oak High School.
Ownership History
Date
Name
Owned For
Owner Type
Purchase Details
Closed on
Jun 23, 2021
Sold by
Nogard John M and Nogard Diane
Bought by
Nogard John M and Nogard Diane L
Current Estimated Value
Home Financials for this Owner
Home Financials are based on the most recent Mortgage that was taken out on this home.
Original Mortgage
$511,000
Outstanding Balance
$462,647
Interest Rate
2.9%
Mortgage Type
New Conventional
Estimated Equity
$874,298
Purchase Details
Closed on
Jul 18, 2018
Sold by
Nogard John M and Nogard Diane
Bought by
Nogard John M and Nogard Diane L
Purchase Details
Closed on
Jul 29, 1998
Sold by
Benefi Raymond N Bolton Law Corp Defined and Bolton Shirley
Bought by
Norgard John M and Norgard Diane
Home Financials for this Owner
Home Financials are based on the most recent Mortgage that was taken out on this home.
Original Mortgage
$49,500
Interest Rate
6.95%
Mortgage Type
Credit Line Revolving
Create a Home Valuation Report for This Property
The Home Valuation Report is an in-depth analysis detailing your home's value as well as a comparison with similar homes in the area
Home Values in the Area
Average Home Value in this Area
Purchase History
| Date | Buyer | Sale Price | Title Company |
|---|---|---|---|
| Nogard John M | -- | Fidelity Natl Ttl Co Mclpc | |
| Nogard John M | -- | None Available | |
| Norgard John M | $330,000 | First American Title Guarant |
Source: Public Records
Mortgage History
| Date | Status | Borrower | Loan Amount |
|---|---|---|---|
| Open | Nogard John M | $511,000 | |
| Closed | Norgard John M | $49,500 | |
| Closed | Norgard John M | $263,950 |
Source: Public Records
Tax History Compared to Growth
Tax History
| Year | Tax Paid | Tax Assessment Tax Assessment Total Assessment is a certain percentage of the fair market value that is determined by local assessors to be the total taxable value of land and additions on the property. | Land | Improvement |
|---|---|---|---|---|
| 2025 | $5,842 | $516,930 | $258,347 | $258,583 |
| 2024 | $5,842 | $506,795 | $253,282 | $253,513 |
| 2023 | $5,873 | $496,859 | $248,316 | $248,543 |
| 2022 | $5,774 | $487,118 | $243,448 | $243,670 |
| 2021 | $5,631 | $477,568 | $238,675 | $238,893 |
| 2020 | $5,498 | $472,672 | $236,228 | $236,444 |
| 2019 | $5,647 | $463,405 | $231,597 | $231,808 |
| 2018 | $5,661 | $454,319 | $227,056 | $227,263 |
| 2017 | $5,607 | $445,411 | $222,604 | $222,807 |
| 2016 | $5,256 | $436,679 | $218,240 | $218,439 |
| 2015 | $5,199 | $430,120 | $214,962 | $215,158 |
| 2014 | $5,260 | $421,696 | $210,752 | $210,944 |
Source: Public Records
Map
Nearby Homes
- 0 W San Martin Ave
- 30 Chester Ave
- 12645 Harding Ave
- 0 Llagas Ave Unit ML82019140
- 905 E San Martin Ave
- 13705 Sycamore Ave
- 13640 Sycamore Ave
- 13690 Murphy Ave #E
- 12320 Highland Estates Ln
- 12315 Harding Ave
- 12755 Santa Teresa Blvd
- 13755 Columbet Ave
- 13035 Center Ave
- 14325 Monterey Rd
- 14430 Monterey Hwy
- 12550 Center Ave
- 475 E Middle Ave
- 1265 Lions Peak Ln
- 1322 Lions Peak Ln
- 1305 Lions Peak Ln
- 13155 Llagas Ave
- 185 South St
- 13140 Lincoln Ave
- 13120 Lincoln Ave
- 13175 Llagas Ave
- 13150 Lincoln Ave
- 145 South St
- 13150 Llagas Ave
- 13140 Llagas Ave
- 13120 Llagas Ave
- 13110 Lincoln Ave
- 13160 Llagas Ave
- 13110 Llagas Ave
- 13185 Llagas Ave
- 13145 Lincoln Ave
- 13080 Llagas Ave
- 13115 Lincoln Ave
- 13155 Lincoln Ave
- 13105 Lincoln Ave
- 13165 Lincoln Ave