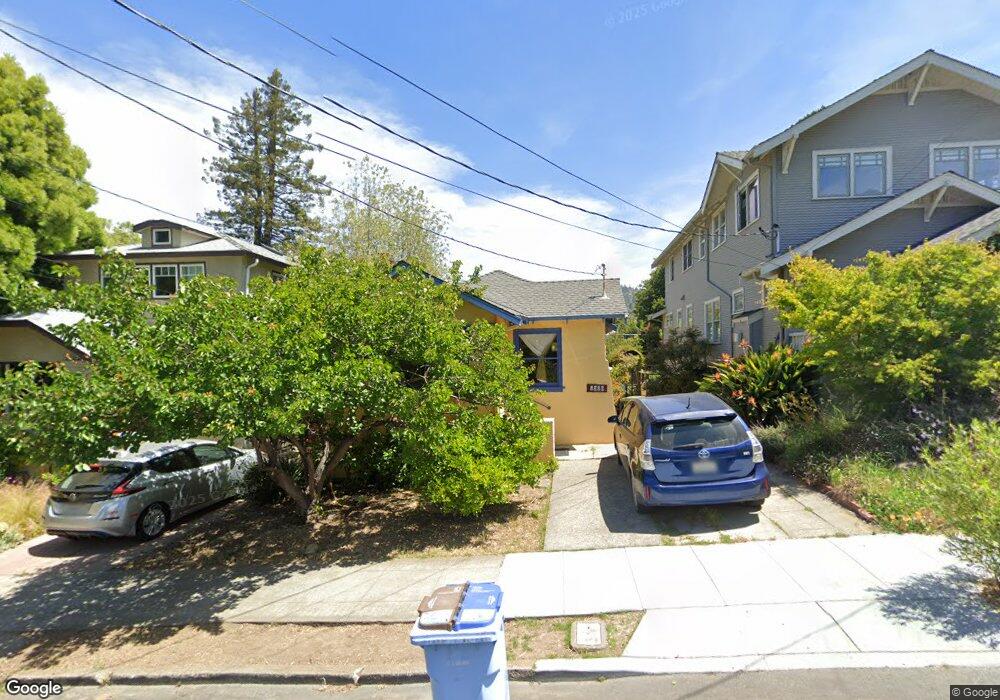
1315 Carlotta Ave Berkeley, CA 94703
North Berkeley NeighborhoodEstimated Value: $1,151,000 - $1,752,000
3
Beds
2
Baths
1,340
Sq Ft
$1,101/Sq Ft
Est. Value
About This Home
This home is located at 1315 Carlotta Ave, Berkeley, CA 94703 and is currently estimated at $1,475,975, approximately $1,101 per square foot. 1315 Carlotta Ave is a home located in Alameda County with nearby schools including Ruth Acty Elementary, Berkeley Arts Magnet at Whittier School, and Thousand Oaks Elementary School.
Ownership History
Date
Name
Owned For
Owner Type
Purchase Details
Closed on
Mar 9, 2024
Sold by
Roach Scott David
Bought by
Clark Dana L
Current Estimated Value
Purchase Details
Closed on
Apr 19, 2012
Sold by
Roach Scott David and Clark Dana L
Bought by
Clark Dana L
Home Financials for this Owner
Home Financials are based on the most recent Mortgage that was taken out on this home.
Original Mortgage
$342,000
Interest Rate
3.9%
Mortgage Type
New Conventional
Purchase Details
Closed on
Jan 15, 2002
Sold by
Kimlinger Roseanne and Anne V Kimlinger Trust
Bought by
Clark Dana L
Home Financials for this Owner
Home Financials are based on the most recent Mortgage that was taken out on this home.
Original Mortgage
$316,000
Interest Rate
6.87%
Purchase Details
Closed on
May 29, 2000
Sold by
Rachelle Kimlinger Roseanne and Rachelle Hearte
Bought by
Kimlinger Roseanne
Create a Home Valuation Report for This Property
The Home Valuation Report is an in-depth analysis detailing your home's value as well as a comparison with similar homes in the area
Home Values in the Area
Average Home Value in this Area
Purchase History
| Date | Buyer | Sale Price | Title Company |
|---|---|---|---|
| Clark Dana L | -- | None Listed On Document | |
| Clark Dana L | -- | First American Title Company | |
| Clark Dana L | $395,000 | Old Republic Title Company | |
| Kimlinger Roseanne | -- | -- |
Source: Public Records
Mortgage History
| Date | Status | Borrower | Loan Amount |
|---|---|---|---|
| Previous Owner | Clark Dana L | $342,000 | |
| Previous Owner | Clark Dana L | $316,000 |
Source: Public Records
Tax History
| Year | Tax Paid | Tax Assessment Tax Assessment Total Assessment is a certain percentage of the fair market value that is determined by local assessors to be the total taxable value of land and additions on the property. | Land | Improvement |
|---|---|---|---|---|
| 2025 | $9,737 | $583,493 | $175,048 | $408,445 |
| 2024 | $9,737 | $572,054 | $171,616 | $400,438 |
| 2023 | $9,527 | $560,840 | $168,252 | $392,588 |
| 2022 | $9,339 | $549,843 | $164,953 | $384,890 |
| 2021 | $9,349 | $539,064 | $161,719 | $377,345 |
| 2020 | $8,807 | $533,537 | $160,061 | $373,476 |
| 2019 | $8,416 | $523,078 | $156,923 | $366,155 |
| 2018 | $8,265 | $512,824 | $153,847 | $358,977 |
| 2017 | $7,963 | $502,771 | $150,831 | $351,940 |
| 2016 | $7,677 | $492,915 | $147,874 | $345,041 |
| 2015 | $7,571 | $485,513 | $145,654 | $339,859 |
| 2014 | $7,508 | $476,005 | $142,801 | $333,204 |
Source: Public Records
Map
Nearby Homes
- 1529 Ada St
- 1815 Vine St
- 1425 Martin Luther King jr Way
- 1808 Cedar St
- 1564 Sacramento St
- 1509 Francis St
- 1368 Rose St
- 1950 Hopkins St
- 1408 Henry St
- 1625 Martin Luther King jr Way
- 1609 Bonita Ave Unit 5
- 1610 Milvia St
- 1498 Sonoma Ave
- 1120 Curtis St
- 1127 Key Route Blvd
- 1036 Ramona Ave
- 1444 Walnut St
- 2121 Eunice St
- 1412 Oxford St
- 1436 Delaware St
- 1311 Carlotta Ave
- 1319 Carlotta Ave
- 1321 Carlotta Ave
- 1309 Carlotta Ave
- 1325 Carlotta Ave
- 1327 Carlotta Ave
- 1329 Carlotta Ave
- 1316 Carlotta Ave
- 1318 Carlotta Ave
- 1314 Carlotta Ave
- 1322 Carlotta Ave
- 1310 Carlotta Ave
- 1628 Hopkins St
- 1302 Carlotta Ave Unit 1
- 1333 Carlotta Ave
- 1304 Carlotta Ave Unit 2
- 1326 Carlotta Ave
- 1624 Hopkins St
- 1335 Carlotta Ave
- 1328 Carlotta Ave
Your Personal Tour Guide
Ask me questions while you tour the home.