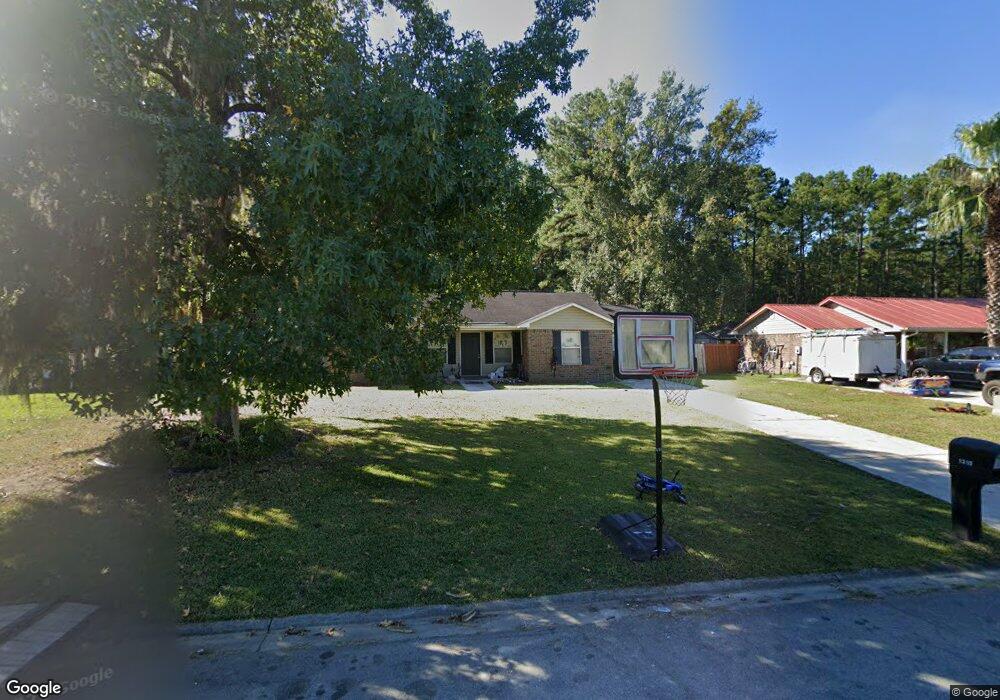
1315 Djs Way Pooler, GA 31322
Estimated Value: $254,288 - $288,000
3
Beds
2
Baths
1,412
Sq Ft
$191/Sq Ft
Est. Value
About This Home
This home is located at 1315 Djs Way, Pooler, GA 31322 and is currently estimated at $269,322, approximately $190 per square foot. 1315 Djs Way is a home located in Chatham County with nearby schools including Pooler Elementary School, West Chatham Middle School, and Groves High School.
Ownership History
Date
Name
Owned For
Owner Type
Purchase Details
Closed on
Oct 27, 2024
Sold by
Nava Maria D
Bought by
Vasquez Juan Carlos Nava and Vasquez Kayla N
Current Estimated Value
Home Financials for this Owner
Home Financials are based on the most recent Mortgage that was taken out on this home.
Original Mortgage
$179,080
Interest Rate
4.87%
Mortgage Type
FHA
Purchase Details
Closed on
Jun 1, 2018
Sold by
Chaparro Angel L
Bought by
Vasquez Juan Carlos Nava and Nava Maria D
Home Financials for this Owner
Home Financials are based on the most recent Mortgage that was taken out on this home.
Original Mortgage
$96,866
Interest Rate
5.5%
Mortgage Type
FHA
Purchase Details
Closed on
Sep 7, 2004
Sold by
Weaver Guy C and Weaver Daniele M
Bought by
Chaparro Angel L and Chaparro Leticia G
Create a Home Valuation Report for This Property
The Home Valuation Report is an in-depth analysis detailing your home's value as well as a comparison with similar homes in the area
Home Values in the Area
Average Home Value in this Area
Purchase History
| Date | Buyer | Sale Price | Title Company |
|---|---|---|---|
| Vasquez Juan Carlos Nava | -- | -- | |
| Vasquez Juan Carlos Nava | $119,000 | -- | |
| Chaparro Angel L | $118,000 | -- |
Source: Public Records
Mortgage History
| Date | Status | Borrower | Loan Amount |
|---|---|---|---|
| Previous Owner | Vasquez Juan Carlos Nava | $179,080 | |
| Previous Owner | Vasquez Juan Carlos Nava | $96,866 |
Source: Public Records
Tax History
| Year | Tax Paid | Tax Assessment Tax Assessment Total Assessment is a certain percentage of the fair market value that is determined by local assessors to be the total taxable value of land and additions on the property. | Land | Improvement |
|---|---|---|---|---|
| 2025 | $2,877 | $87,280 | $18,000 | $69,280 |
| 2024 | $27 | $87,880 | $18,000 | $69,880 |
| 2023 | $2,709 | $84,840 | $18,000 | $66,840 |
| 2022 | $1,769 | $63,160 | $6,000 | $57,160 |
| 2021 | $1,788 | $51,600 | $6,000 | $45,600 |
| 2020 | $1,627 | $50,720 | $6,000 | $44,720 |
| 2019 | $1,627 | $47,600 | $5,379 | $42,221 |
| 2018 | $1,205 | $51,560 | $6,000 | $45,560 |
| 2017 | $1,199 | $43,200 | $6,000 | $37,200 |
| 2016 | $1,199 | $42,720 | $6,000 | $36,720 |
| 2015 | $976 | $35,600 | $6,000 | $29,600 |
| 2014 | $1,536 | $35,680 | $0 | $0 |
Source: Public Records
Map
Nearby Homes
- 1257 Roberts Way
- 1258 Homer City Way
- 1245 Weston Way
- 1324 S Rogers St
- 1230 S Rogers St
- 466 Governor Treutlen Cir
- 449 Governor Treutlen Cir
- 545 Governor Treutlen Cir
- 439 Governor Treutlen Cir
- 111 Ashwood Dr
- 425 Governor Treutlen Cir
- 315 Governor Gwinnett Way
- 302 Governor Gwinnett Way
- 576 Governor Treutlen Cir
- 4 Oak Leaf Place
- 149 Danbury Ct
- 119 Holloway Hill
- 126 Holloway Hill
- 167 Holloway Hill
- 104 Redfield Dr
Your Personal Tour Guide
Ask me questions while you tour the home.