1315 E Calumet St Centralia, IL 62801
Estimated Value: $468,258 - $511,000
6
Beds
5
Baths
6,030
Sq Ft
$81/Sq Ft
Est. Value
About This Home
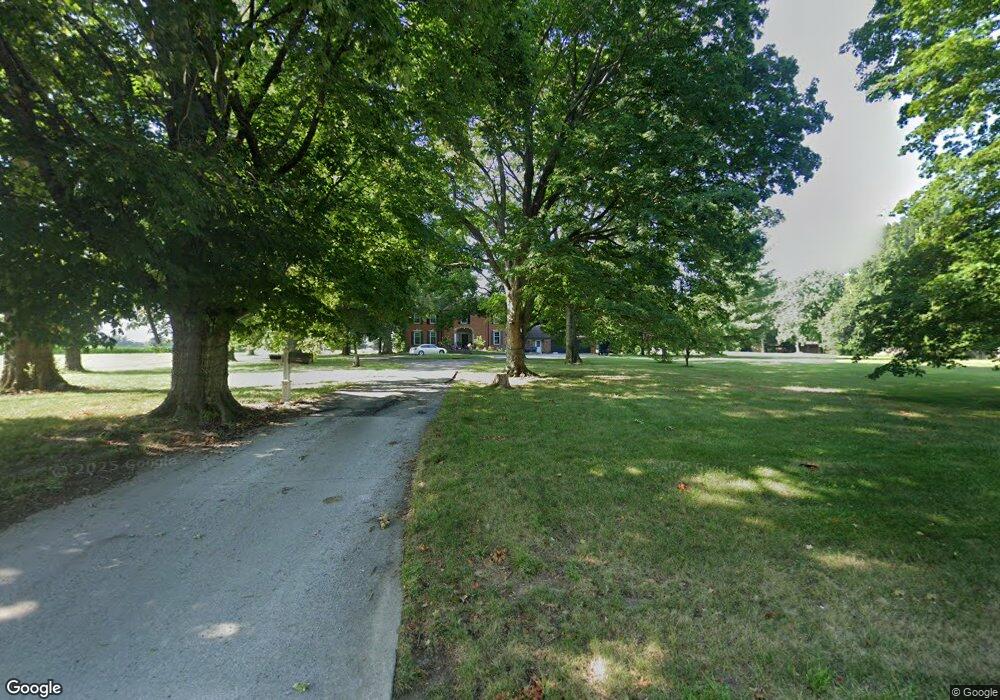
This home is located at 1315 E Calumet St, Centralia, IL 62801 and is currently estimated at $489,629, approximately $81 per square foot. 1315 E Calumet St is a home located in Marion County with nearby schools including Centralia High School, St. Mary School, and Trinity Lutheran School.
Ownership History
Date
Name
Owned For
Owner Type
Purchase Details
Closed on
Jun 28, 2016
Sold by
Neudecker Michael D
Bought by
Neudecker Michael D and Neudekcer Karisa
Current Estimated Value
Home Financials for this Owner
Home Financials are based on the most recent Mortgage that was taken out on this home.
Original Mortgage
$293,600
Outstanding Balance
$236,548
Interest Rate
3.87%
Mortgage Type
New Conventional
Estimated Equity
$253,081
Purchase Details
Closed on
Mar 13, 2009
Sold by
Federal Home Loan Mortgage Corporation
Bought by
Nuedecker Ladonne
Home Financials for this Owner
Home Financials are based on the most recent Mortgage that was taken out on this home.
Original Mortgage
$208,000
Interest Rate
0.7%
Mortgage Type
Purchase Money Mortgage
Purchase Details
Closed on
Oct 7, 2008
Sold by
Griffith John Lioyd and Griffith John
Bought by
Federal National Mortgage Association
Create a Home Valuation Report for This Property
The Home Valuation Report is an in-depth analysis detailing your home's value as well as a comparison with similar homes in the area
Home Values in the Area
Average Home Value in this Area
Purchase History
We collect this data history from publicly available records. To have your information removed, we recommend requesting removal directly through your county’s website.
| Date | Buyer | Sale Price | Title Company |
|---|---|---|---|
| Neudecker Michael D | -- | Quad County Title | |
| Nuedecker Ladonne | $90,000 | None Available | |
| Federal National Mortgage Association | -- | None Available |
Source: Public Records
Mortgage History
We collect this data history from publicly available records. To have your information removed, we recommend requesting removal directly through your county’s website.
| Date | Status | Borrower | Loan Amount |
|---|---|---|---|
| Open | Neudecker Michael D | $293,600 | |
| Closed | Nuedecker Ladonne | $208,000 |
Source: Public Records
Tax History
| Year | Tax Paid | Tax Assessment Tax Assessment Total Assessment is a certain percentage of the fair market value that is determined by local assessors to be the total taxable value of land and additions on the property. | Land | Improvement |
|---|---|---|---|---|
| 2024 | $8,940 | $146,670 | $21,160 | $125,510 |
| 2023 | $9,143 | $137,080 | $19,780 | $117,300 |
| 2022 | $9,010 | $124,620 | $17,980 | $106,640 |
| 2021 | $8,838 | $116,460 | $16,800 | $99,660 |
| 2020 | $8,647 | $112,980 | $16,300 | $96,680 |
| 2019 | $8,533 | $108,840 | $15,700 | $93,140 |
| 2018 | $8,666 | $108,840 | $15,700 | $93,140 |
| 2017 | $8,596 | $106,700 | $15,390 | $91,310 |
| 2016 | $8,520 | $102,600 | $14,800 | $87,800 |
| 2015 | $83 | $102,600 | $14,800 | $87,800 |
| 2012 | $70 | $100,610 | $14,110 | $86,500 |
Source: Public Records
Map
Nearby Homes
- 122 E Calumet St
- 521 Marquis Ave
- 1114 S Perrine Ave
- 0 Frazier Ave
- 605 Oakdale Dr
- 438 Anderson St
- 1 Charles Dr
- 407 S Davis Ave
- 4 Lilac Ln
- 433 Linden Ave
- 404 S Perrine Ave
- 53 Pine Hurst Place
- 52 Pine Hurst Place
- 630 Short St
- 322 Linden Ave
- 4 Coronado Dr
- 831 E 5th St
- 532 Kristy Dr
- 8 Ronnies Terrace
- 334 S Lincoln Blvd
- 1255 E Calumet St
- 10 Orchard Dr
- 10 Orchard Dr E
- 11 Orchard Dr E
- 632 S Davis Ave
- 633 S Davis Ave
- 1262 E Calumet St
- 636 S Pleasant Ave
- 2450 E Calumet St
- 622 S Davis Ave
- 12 Orchard Dr
- 12 Orchard Dr
- 627 S Davis Ave
- 9 Orchard Dr
- 630 S Pleasant Ave
- 39 Evergreen Dr
- 1250 E Calumet St
- 14 Orchard Dr E
- 717 & 719 E Calumet St
- 0 E Calumet St
Your Personal Tour Guide
Ask me questions while you tour the home.