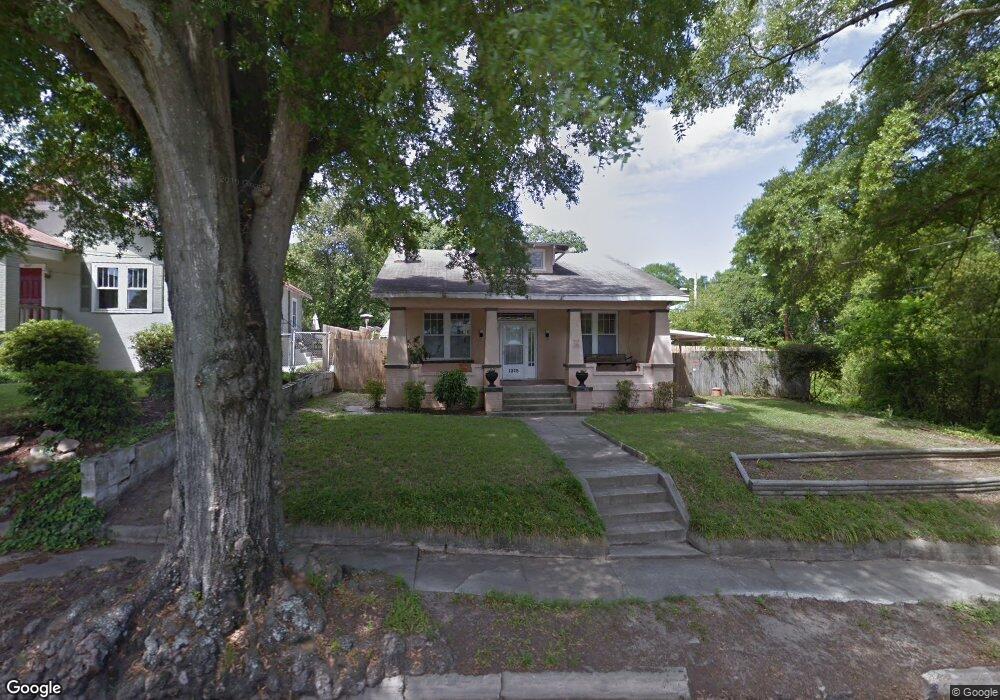
1315 Milledge Rd Augusta, GA 30904
Summerville NeighborhoodEstimated Value: $274,000 - $357,000
3
Beds
2
Baths
1,774
Sq Ft
$180/Sq Ft
Est. Value
About This Home
This home is located at 1315 Milledge Rd, Augusta, GA 30904 and is currently estimated at $319,912, approximately $180 per square foot. 1315 Milledge Rd is a home located in Richmond County with nearby schools including Monte Sano Elementary School, Johnson Magnet, and Tutt Middle School.
Ownership History
Date
Name
Owned For
Owner Type
Purchase Details
Closed on
Feb 1, 2021
Sold by
Sloop Shawnee L
Bought by
Cullison Brenda
Current Estimated Value
Home Financials for this Owner
Home Financials are based on the most recent Mortgage that was taken out on this home.
Original Mortgage
$237,500
Outstanding Balance
$210,077
Interest Rate
2.6%
Mortgage Type
New Conventional
Estimated Equity
$109,835
Purchase Details
Closed on
Jun 29, 2007
Sold by
Clark James E and Gunby Margaret Elaine
Bought by
Sloop Shawnee L
Home Financials for this Owner
Home Financials are based on the most recent Mortgage that was taken out on this home.
Original Mortgage
$112,000
Interest Rate
6.35%
Mortgage Type
Purchase Money Mortgage
Purchase Details
Closed on
Dec 1, 1982
Create a Home Valuation Report for This Property
The Home Valuation Report is an in-depth analysis detailing your home's value as well as a comparison with similar homes in the area
Home Values in the Area
Average Home Value in this Area
Purchase History
| Date | Buyer | Sale Price | Title Company |
|---|---|---|---|
| Cullison Brenda | $250,000 | -- | |
| Sloop Shawnee L | $140,000 | None Available | |
| -- | $65,000 | -- |
Source: Public Records
Mortgage History
| Date | Status | Borrower | Loan Amount |
|---|---|---|---|
| Open | Cullison Brenda | $237,500 | |
| Previous Owner | Sloop Shawnee L | $112,000 |
Source: Public Records
Tax History
| Year | Tax Paid | Tax Assessment Tax Assessment Total Assessment is a certain percentage of the fair market value that is determined by local assessors to be the total taxable value of land and additions on the property. | Land | Improvement |
|---|---|---|---|---|
| 2025 | $3,929 | $122,572 | $30,061 | $92,511 |
| 2024 | $3,929 | $111,464 | $30,061 | $81,403 |
| 2023 | $3,536 | $110,616 | $30,061 | $80,555 |
| 2022 | $3,161 | $93,210 | $30,061 | $63,149 |
| 2021 | $2,975 | $84,329 | $30,061 | $54,268 |
| 2020 | $2,269 | $64,278 | $15,137 | $49,141 |
| 2019 | $2,409 | $64,278 | $15,137 | $49,141 |
| 2018 | $2,414 | $63,873 | $15,137 | $48,736 |
| 2017 | $2,402 | $63,873 | $15,137 | $48,736 |
| 2016 | $2,403 | $63,873 | $15,137 | $48,736 |
| 2015 | $2,418 | $63,873 | $15,137 | $48,736 |
| 2014 | $2,421 | $63,873 | $15,137 | $48,736 |
Source: Public Records
Map
Nearby Homes
- 2212 Central Ave
- 1219 Winter St
- 2232 Mcdowell St
- 2144 Central Ave
- 1224 Meigs St
- 815 Johns Rd
- 1440 Johns Rd
- 1232 Hickman Rd
- 1123 Cobb St
- 1327 Hickman Rd
- 1425 Troupe St
- 1516 Johns Rd
- 1213 Heard Ave
- 1433 Troupe St
- 1435 Troupe St
- 1437 Troupe St
- 2114 Carnes Place
- 1010 Hickman Rd Unit 5b
- 978 Heard Ave
- 1422 Heard Ave
- 1317 Milledge Rd
- 1319 Milledge Rd
- 2210 Central Ave
- 2208 Central Ave
- 2214 Central Ave
- 1318 Wingfield St
- 1321 Milledge Rd
- 1320 Wingfield St
- 1326 Wingfield St
- 2216 Central Ave
- 2206 Central Ave
- 1310 Milledge Rd
- 1323 Milledge Rd
- 1312 Milledge Rd
- 1328 Wingfield St
- 2204 Central Ave
- 1314 Milledge Rd
- 2220 Central Ave
- 1325 Milledge Rd
- 2202 Central Ave
Your Personal Tour Guide
Ask me questions while you tour the home.