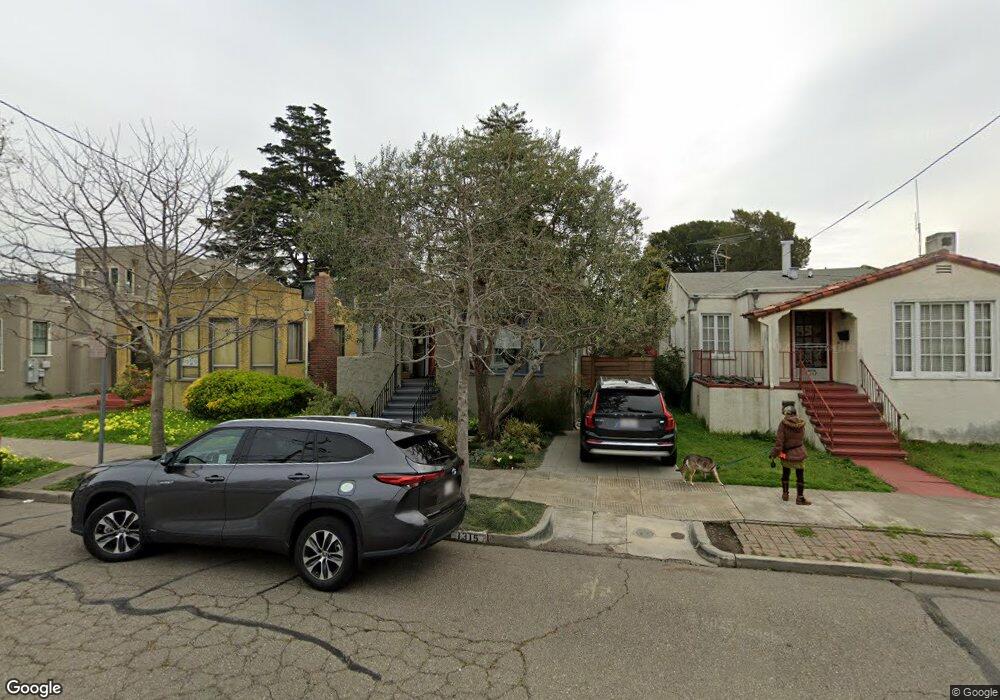
1315 Ordway St Berkeley, CA 94702
West Berkeley NeighborhoodEstimated Value: $1,487,000 - $1,807,000
3
Beds
3
Baths
1,701
Sq Ft
$963/Sq Ft
Est. Value
About This Home
This home is located at 1315 Ordway St, Berkeley, CA 94702 and is currently estimated at $1,637,560, approximately $962 per square foot. 1315 Ordway St is a home located in Alameda County with nearby schools including Ruth Acty Elementary, Thousand Oaks Elementary School, and Berkeley Arts Magnet at Whittier School.
Ownership History
Date
Name
Owned For
Owner Type
Purchase Details
Closed on
Jan 9, 2020
Sold by
Bycel Matthew and Davidson Danielle R
Bought by
Bycel Matthew and Davidson Danlelle R
Current Estimated Value
Home Financials for this Owner
Home Financials are based on the most recent Mortgage that was taken out on this home.
Original Mortgage
$738,000
Outstanding Balance
$652,052
Interest Rate
3.6%
Mortgage Type
New Conventional
Estimated Equity
$985,508
Purchase Details
Closed on
Aug 9, 2018
Sold by
Christensen Kim B and Christensen Sarah A
Bought by
Bycel Matthew and Davidson Danielle R
Home Financials for this Owner
Home Financials are based on the most recent Mortgage that was taken out on this home.
Original Mortgage
$750,000
Interest Rate
4.5%
Mortgage Type
New Conventional
Purchase Details
Closed on
Jan 3, 2011
Sold by
Christensen Kim B and Christensen Sarah A
Bought by
Christensen Kim B and Christensen Sarah A
Home Financials for this Owner
Home Financials are based on the most recent Mortgage that was taken out on this home.
Original Mortgage
$426,000
Interest Rate
4.43%
Mortgage Type
New Conventional
Purchase Details
Closed on
Jan 7, 2005
Sold by
Christensen Kim B and Christensen Sarah A
Bought by
Christensen Kim B and Christensen Sarah A
Home Financials for this Owner
Home Financials are based on the most recent Mortgage that was taken out on this home.
Original Mortgage
$460,000
Interest Rate
5.8%
Mortgage Type
New Conventional
Purchase Details
Closed on
Nov 4, 2004
Sold by
Christensen Sarah and Christensen Kim
Bought by
Christensen Kim B and Christensen Sarah A
Purchase Details
Closed on
Dec 11, 1993
Sold by
Dickerhoff Darryl Jon and Dickerhoff Douglas Diane
Bought by
Christensen Kim and Christensen Sarah
Home Financials for this Owner
Home Financials are based on the most recent Mortgage that was taken out on this home.
Original Mortgage
$223,200
Interest Rate
7.09%
Create a Home Valuation Report for This Property
The Home Valuation Report is an in-depth analysis detailing your home's value as well as a comparison with similar homes in the area
Home Values in the Area
Average Home Value in this Area
Purchase History
| Date | Buyer | Sale Price | Title Company |
|---|---|---|---|
| Bycel Matthew | -- | Old Republic Title Company | |
| Bycel Matthew | $1,300,000 | Old Republic Title Company | |
| Christensen Kim B | -- | Fidelity National Title Comp | |
| Christensen Kim B | -- | Fidelity National Title Comp | |
| Christensen Kim B | -- | Fidelity National Title Co | |
| Christensen Kim B | -- | Fidelity National Title Co | |
| Christensen Kim B | -- | -- | |
| Christensen Kim | $248,000 | Placer Title Company |
Source: Public Records
Mortgage History
| Date | Status | Borrower | Loan Amount |
|---|---|---|---|
| Open | Bycel Matthew | $738,000 | |
| Closed | Bycel Matthew | $750,000 | |
| Previous Owner | Christensen Kim B | $426,000 | |
| Previous Owner | Christensen Kim B | $460,000 | |
| Previous Owner | Christensen Kim | $223,200 |
Source: Public Records
Tax History
| Year | Tax Paid | Tax Assessment Tax Assessment Total Assessment is a certain percentage of the fair market value that is determined by local assessors to be the total taxable value of land and additions on the property. | Land | Improvement |
|---|---|---|---|---|
| 2025 | $21,535 | $1,496,210 | $435,045 | $1,068,165 |
| 2024 | $21,535 | $1,466,738 | $426,515 | $1,047,223 |
| 2023 | $21,046 | $1,444,846 | $418,154 | $1,026,692 |
| 2022 | $21,198 | $1,409,520 | $409,956 | $1,006,564 |
| 2021 | $19,436 | $1,332,727 | $401,918 | $937,809 |
| 2020 | $18,532 | $1,326,000 | $397,800 | $928,200 |
| 2019 | $18,206 | $1,300,000 | $390,000 | $910,000 |
| 2018 | $7,065 | $391,074 | $111,134 | $279,940 |
| 2017 | $6,799 | $383,408 | $108,955 | $274,453 |
| 2016 | $6,534 | $375,891 | $106,819 | $269,072 |
| 2015 | $6,433 | $370,247 | $105,215 | $265,032 |
| 2014 | $6,361 | $362,995 | $103,154 | $259,841 |
Source: Public Records
Map
Nearby Homes
- 1329 Ordway St
- 1120 Curtis St
- 1127 Key Route Blvd
- 1339 Kains Ave
- 1626 Hopkins St
- 1322 Virginia St
- 1114 Talbot Ave
- 1036 Ramona Ave
- 1498 Sonoma Ave
- 1728 Curtis St
- 1504 10th St
- 1741 Sonoma Ave
- 1527 Hearst Ave
- 1136 Marin Ave
- 995 Virginia St
- 1841 Vine St
- 1919 Curtis St
- 1425 Martin Luther King jr Way
- 986 Kains Ave
- 1716 Hearst Ave
Your Personal Tour Guide
Ask me questions while you tour the home.