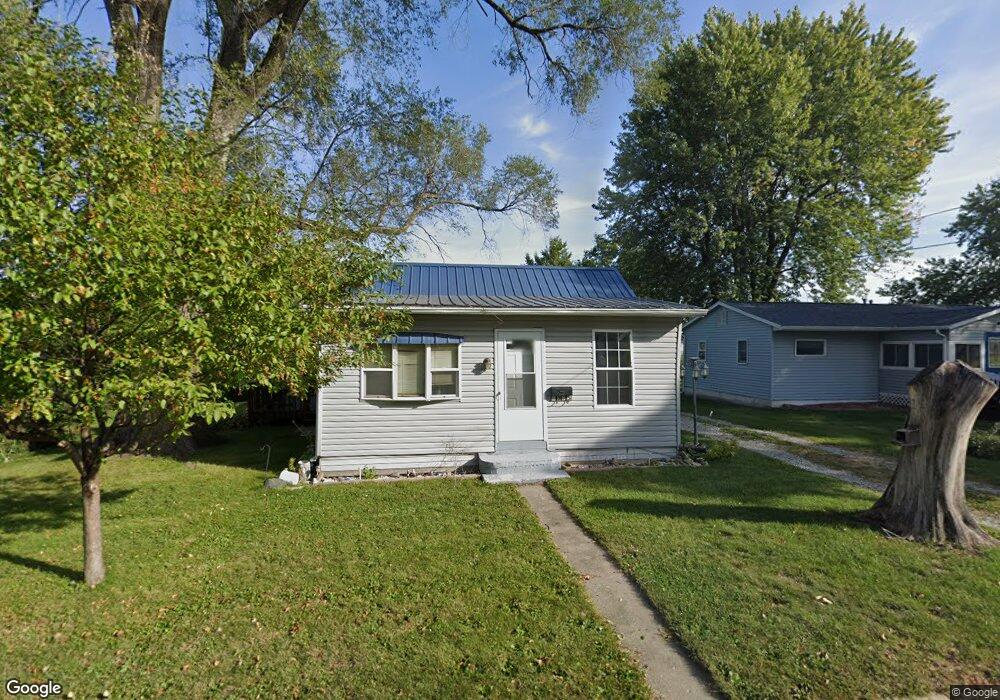
1315 W 3rd St Vinton, IA 52349
Estimated Value: $77,065 - $136,000
1
Bed
1
Bath
748
Sq Ft
$139/Sq Ft
Est. Value
About This Home
This home is located at 1315 W 3rd St, Vinton, IA 52349 and is currently estimated at $104,266, approximately $139 per square foot. 1315 W 3rd St is a home located in Benton County with nearby schools including Tilford Elementary School, Vinton-Shellsburg Middle School, and Vinton-Shellsburg High School.
Ownership History
Date
Name
Owned For
Owner Type
Purchase Details
Closed on
Mar 11, 2013
Sold by
Bright James H
Bought by
Bright Ralph E and Bright Joannne M
Current Estimated Value
Home Financials for this Owner
Home Financials are based on the most recent Mortgage that was taken out on this home.
Original Mortgage
$55,415
Outstanding Balance
$39,034
Interest Rate
3.5%
Mortgage Type
FHA
Estimated Equity
$65,232
Purchase Details
Closed on
Sep 22, 2006
Sold by
The Estate Of Jessie E Geater
Bought by
Bright James H and Bright Ralph E
Create a Home Valuation Report for This Property
The Home Valuation Report is an in-depth analysis detailing your home's value as well as a comparison with similar homes in the area
Home Values in the Area
Average Home Value in this Area
Purchase History
| Date | Buyer | Sale Price | Title Company |
|---|---|---|---|
| Bright Ralph E | $65,000 | None Available | |
| Bright James H | $17,000 | None Available |
Source: Public Records
Mortgage History
| Date | Status | Borrower | Loan Amount |
|---|---|---|---|
| Open | Bright Ralph E | $55,415 |
Source: Public Records
Tax History
| Year | Tax Paid | Tax Assessment Tax Assessment Total Assessment is a certain percentage of the fair market value that is determined by local assessors to be the total taxable value of land and additions on the property. | Land | Improvement |
|---|---|---|---|---|
| 2025 | $978 | $83,800 | $20,000 | $63,800 |
| 2024 | $978 | $76,100 | $19,100 | $57,000 |
| 2023 | $1,132 | $76,100 | $19,100 | $57,000 |
| 2022 | $1,160 | $61,500 | $15,300 | $46,200 |
| 2021 | $1,160 | $61,500 | $15,300 | $46,200 |
| 2020 | $1,212 | $64,800 | $11,100 | $53,700 |
| 2019 | $1,164 | $64,800 | $11,100 | $53,700 |
| 2018 | $1,126 | $61,600 | $10,100 | $51,500 |
| 2017 | $1,074 | $61,600 | $10,100 | $51,500 |
| 2016 | $1,052 | $57,500 | $9,400 | $48,100 |
| 2015 | $1,052 | $57,500 | $9,400 | $48,100 |
| 2014 | $1,064 | $57,900 | $0 | $0 |
Source: Public Records
Map
Nearby Homes