Estimated Value: $688,000 - $759,000
4
Beds
2
Baths
1,392
Sq Ft
$526/Sq Ft
Est. Value
About This Home
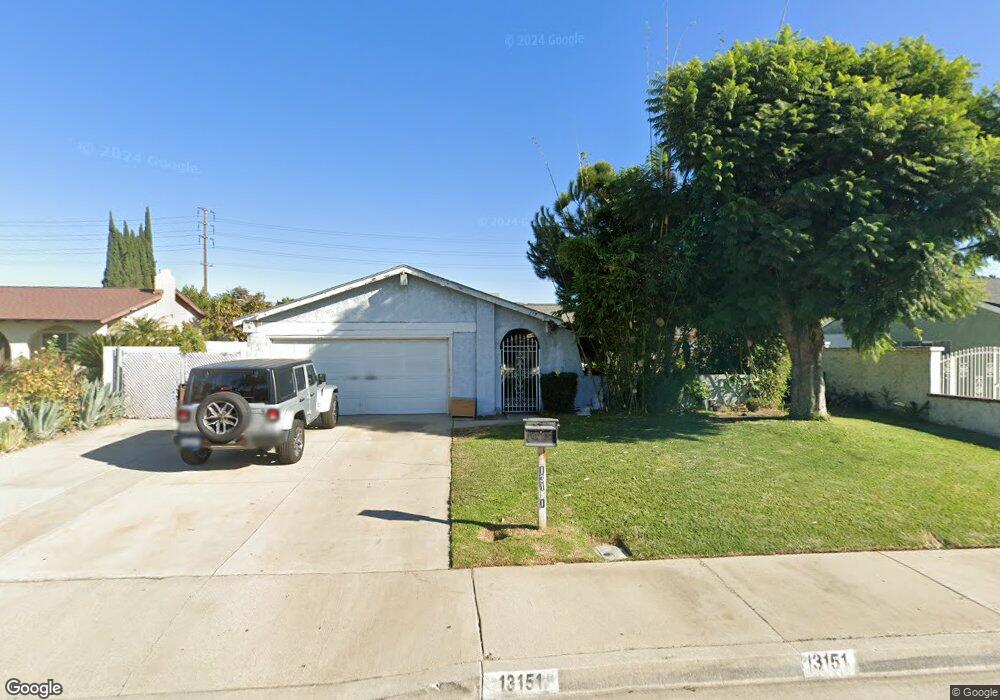
This home is located at 13151 Sequoia Ave, Chino, CA 91710 and is currently estimated at $732,307, approximately $526 per square foot. 13151 Sequoia Ave is a home located in San Bernardino County with nearby schools including Alicia Cortez Elementary, Magnolia Junior High, and Chino High School.
Ownership History
Date
Name
Owned For
Owner Type
Purchase Details
Closed on
Dec 22, 2005
Sold by
Toll Carl Russell and Toll Sharon Ann
Bought by
Ramirez Feliciano P
Current Estimated Value
Home Financials for this Owner
Home Financials are based on the most recent Mortgage that was taken out on this home.
Original Mortgage
$360,000
Interest Rate
6.87%
Mortgage Type
Purchase Money Mortgage
Purchase Details
Closed on
Aug 21, 2001
Sold by
Toll Carl R and Toll Sharon A
Bought by
Toll Carl Russell and Toll Sharon Ann
Purchase Details
Closed on
Jun 12, 2001
Sold by
Toll Carl R and Toll Sharon Ann
Bought by
Toll Carl R and Toll Sharon A
Home Financials for this Owner
Home Financials are based on the most recent Mortgage that was taken out on this home.
Original Mortgage
$109,000
Interest Rate
7.14%
Purchase Details
Closed on
Aug 21, 1999
Sold by
Toll Carl R and Toll Sharon A
Bought by
Toll Carl Russell and Toll Sharon Ann
Create a Home Valuation Report for This Property
The Home Valuation Report is an in-depth analysis detailing your home's value as well as a comparison with similar homes in the area
Home Values in the Area
Average Home Value in this Area
Purchase History
| Date | Buyer | Sale Price | Title Company |
|---|---|---|---|
| Ramirez Feliciano P | $450,000 | Chicago Title Company | |
| Toll Carl Russell | -- | -- | |
| Toll Carl R | -- | Southland Title Corporation | |
| Toll Carl Russell | -- | -- |
Source: Public Records
Mortgage History
| Date | Status | Borrower | Loan Amount |
|---|---|---|---|
| Previous Owner | Ramirez Feliciano P | $360,000 | |
| Previous Owner | Toll Carl R | $109,000 |
Source: Public Records
Tax History Compared to Growth
Tax History
| Year | Tax Paid | Tax Assessment Tax Assessment Total Assessment is a certain percentage of the fair market value that is determined by local assessors to be the total taxable value of land and additions on the property. | Land | Improvement |
|---|---|---|---|---|
| 2025 | $6,669 | $614,964 | $215,237 | $399,727 |
| 2024 | $6,669 | $602,906 | $211,017 | $391,889 |
| 2023 | $6,484 | $591,084 | $206,879 | $384,205 |
| 2022 | $6,446 | $579,495 | $202,823 | $376,672 |
| 2021 | $5,533 | $497,000 | $174,000 | $323,000 |
| 2020 | $5,216 | $469,700 | $164,500 | $305,200 |
| 2019 | $5,075 | $456,000 | $159,700 | $296,300 |
| 2018 | $5,062 | $456,000 | $159,700 | $296,300 |
| 2017 | $4,831 | $434,300 | $152,100 | $282,200 |
| 2016 | $4,386 | $413,700 | $144,900 | $268,800 |
| 2015 | $4,157 | $394,000 | $138,000 | $256,000 |
| 2014 | $3,674 | $348,000 | $122,000 | $226,000 |
Source: Public Records
Map
Nearby Homes
- 6031 Rosa Ct
- 6061 Barbara St
- 13014 Bermuda Ave
- 12936 Cambridge Ct
- 5925 Riverside Dr Unit 12
- 12951 Red Cedar Way
- 12811 Oaks Ave
- 12951 Benson Ave Unit 118
- 13555 Magnolia Ave
- 13185 14th St
- 6441 Susana St
- 13536 Sycamore Ln
- 13022 Cypress Ave
- 4610 Avondale Ct
- 4665 Avondale Ct
- 4685 Avondale Ct
- 11610 Granville Place
- 12796 17th St
- 13006 Falcon Place
- 5640 Riverside Dr Unit 119
- 13149 Sequoia Ave
- 6060 Rosario St
- 6080 Rosario St
- 13162 Magnolia Ave
- 13158 Magnolia Ave
- 13137 Sequoia Ave
- 6053 Alfredo St
- 6090 Rosario St
- 6050 Rosario St
- 13136 Magnolia Ave
- 13125 Sequoia Ave
- 6041 Alfredo St
- 6040 Rosario St
- 13124 Magnolia Ave
- 6052 Alfredo St
- 6063 Rosario St
- 6075 Rosario St
- 6051 Rosario St
- 6035 Alfredo St
- 6087 Rosario St