NOT LISTED FOR SALE

13153 N Tower Ct Camby, IN 46113

Estimated Value: $374,974 - $391,000

0.29 Acre
$1,315,497 Price per Acre
12,632 Sq Ft Lot

Last Sold January 30, 2014

Last sale price $30,000

Est. 1,172% increase in value since last sale

Current estimated payment $2,293/month

153 Days on Market

About This Lot

As of January 2014

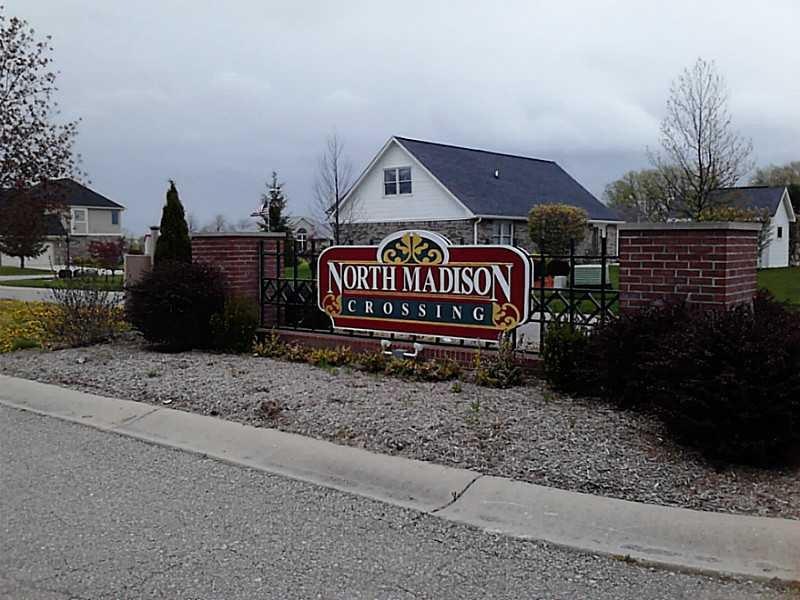
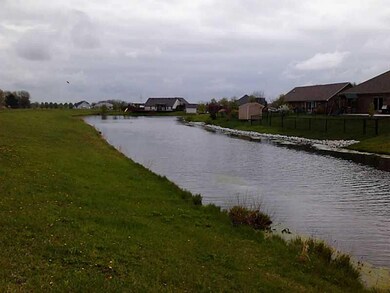
Bring your plans! Bring your builder! You'll feel right at home in this charming rural subdivision located in the northern part of Morgan County. Common areas include lake and park. Utilities include natural gas, electric, water and sewer. Close to shopping, golf course, hospital and schools. Easy access to airport. North Madison Crossing -- A Great Place To Call Home!

Last Agent to Sell the Property

Kevin Smoot

Carpenter, REALTORS® License #RB14025629 Listed on: 05/02/2013

Carpenter, REALTORS®

Co-Listed By

Josh Peters

Carpenter, REALTORS® License #RB14040701

Last Buyer's Agent

Kevin Smoot

Carpenter, REALTORS® License #RB14025629 Listed on: 05/02/2013

Carpenter, REALTORS®

Property Details

Property Type

  • Land

Est. Annual Taxes

  • $1,831

Year Built

  • 2014

Lot Details

HOA Fees

  • $8 per month

Property Details

Property Type

Land

Est. Annual Taxes

$1,831

Year Built

2014

Lot Details

0

HOA Fees

$8 per month

Listing Details

  • Property Type: Land
  • Type: Single Lot
  • Property Sub Type: Residential Lots
  • Transaction Type: Sale
  • Directions: Take St Rd 67 to Bridge St, E on Bridge St (turns into E Landersdale Rd), E Landersdale Rd to subdivision or take St Rd 67 to County Line Rd, E on County Line Rd to Slideoff Rd, S on Slideoff Rd to subdivision.
  • New Construction: No
  • Road Frontage Type: County Road
  • Road Surface Type: Asphalt
  • Subdivision Name: Sub NOT found in Table
  • Special Features: None
  • Year Built (Public Record): 2014

Interior Features

  • Sq Ft Main Upper: 0
  • Below Grade Sq Ft: 0
  • Upper Level Sq Ft: 0

Exterior Features

  • Road Access: CountyRd
  • Water: Municipal Water on Site
  • Disclosures: Not Applicable
  • Other Structures: No Building
  • Topography: Level

Utilities

  • Solid Waste: 0
  • Sewer: Municipal Sewer On Site

Condo/Co-op/Association

  • Association Fee: 100
  • Association Fee Frequency: Annually

Fee Information

  • Association Fee Includes: Insurance, Maintenance

Lot Info

  • Acres: 1/4-1/2 Acre
  • Lot Number: 29
  • Lot Size: 82x150x89x148
  • Improvements: CurbsGuters,PavedStr,StormSewer
  • Land Characteristics: Platted Subdivision
  • Potential Zoning: Single Family
  • Present Zoning: Planned Development,Single Family
  • Price Acre: 112069
  • Soil Type: NotApplic
  • Numberof Lotsin Subdv: 144
  • Development Status: Finished Lot(s)
  • Number Of Lots: 1
  • Zoning: single family, PUD

Tax Info

  • Semi Annual Property Tax Amt: 2
  • Tax Exemption: None
  • Tax Annual Amount: 4
  • Tax Year: 2013

MLS Schools

  • School District: Mooresville Consolidated

Ownership History

Date Name Owned For Owner Type

Purchase Details

Listed on
May 2, 2013
Closed on
Jan 24, 2014
Sold by
Swinney Development Inc
Bought by
Lampi Sharon L
Seller's Agent
Kevin Smoot
Carpenter, REALTORS®
Buyer's Agent
Kevin Smoot
Carpenter, REALTORS®
List Price
$32,500
Sold Price
$30,000
Premium/Discount to List
-$2,500
-7.69%
Total Days on Market
153
Current Estimated Value
$381,494

Home Financials for this Owner

Home Financials are based on the most recent Mortgage that was taken out on this home.
Estimated Appreciation
$351,494
Avg. Annual Appreciation
24.87%
Source: Public Records

Range of Values:

Collateral Analytics

Collateral Analytics Collateral Analytics AVMs (Automated Valuation Model) employ a number of statistical approaches combined with neighborhood-specific comparable selection guarantees the most up-to-date and precise valuations.

Not Available

Collateral Analytics does not have data for the current month. Please view the chart for historical values.

ICE

ICE Mortgage Technology ICE Mortgage Technology’s AVM (Automated Valuation Model) is a state-of-the-art online residential property valuation tool that provides a quick and accurate estimate of the value of almost any home in the U.S.

Not Available

ICE Mortgage Technology does not have data for the current month. Please view the chart for historical values.

First American

First American First American Data & Analytics’ next-generation AVM combines unrivaled data assets with a blended ensemble of valuation models to produce highly accurate, reliable valuations you can trust.

Not Available

First American does not have data for the current month. Please view the chart for historical values.

Quantarium

Quantarium Quantarium’s valuation service, repeatedly proven the industry’s most accurate and comprehensive, is supercharged with a self-learning and auto-tuning AI engine that continually becomes smarter and more accurate as it processes daily inputs from the industry’s leading RE data lake.

Not Available

Quantarium does not have data for the current month. Please view the chart for historical values.

Average Value
Not Available
List Price
Sold Price
Create a Home Valuation Report for This Property
The Home Valuation Report is an in-depth analysis detailing your home's value as well as a comparison with similar homes in the area

Home Values in the Area

Source: Public Records

Average Home Value in this Area


Source: Public Records

Purchase History

Date Buyer Sale Price Title Company
Lampi Sharon L -- None Available
Source: Public Records

Property History

Date Event Price Change Sq Ft Price
01/30/2014 01/30/14 Sold $30,000 -7.7% --
10/03/2013 10/03/13 Pending -- -- --
05/02/2013 05/02/13 For Sale $32,500 -- --
Source: MIBOR Broker Listing Cooperative®

Tax History Compared to Growth

Source: Public Records

Tax History

Year Tax Paid Tax Assessment Tax Assessment Total Assessment is a certain percentage of the fair market value that is determined by local assessors to be the total taxable value of land and additions on the property. Land Improvement
2024 $1,831 $342,400 $54,500 $287,900
2023 $1,679 $344,100 $53,000 $291,100
2022 $1,567 $303,500 $53,000 $250,500
2021 $1,231 $265,900 $30,000 $235,900
2020 $1,356 $283,700 $30,000 $253,700
2019 $1,138 $242,500 $30,000 $212,500
2018 $942 $217,300 $30,000 $187,300
2017 $939 $213,600 $27,500 $186,100
2016 $956 $215,500 $27,500 $188,000
2014 $241 $27,500 $27,500 $0
2013 $241 $500 $500 $0
Source: Public Records

Agents Affiliated with this Home

  • Section Image
  • Section Image
See All Agents

Map

Source: MIBOR Broker Listing Cooperative®

MLS Number: 21229700

MIBOR Broker Listing Cooperative®

APN: 55-02-28-420-012.000-015