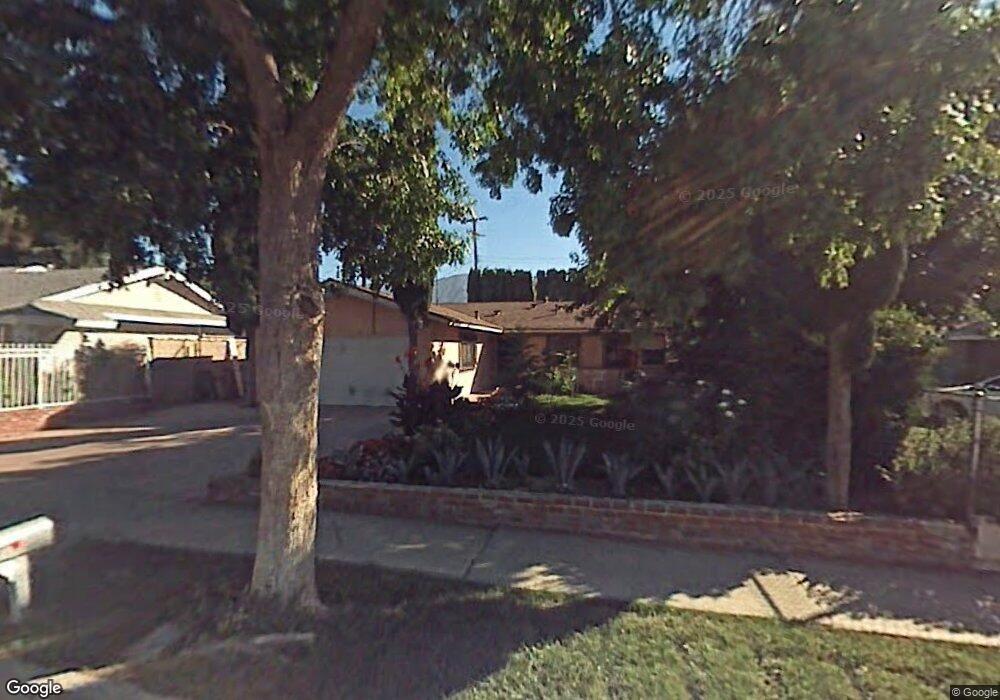
13158 De Garmo Ave Sylmar, CA 91342
Estimated Value: $678,062 - $760,000
3
Beds
2
Baths
1,181
Sq Ft
$611/Sq Ft
Est. Value
About This Home
This home is located at 13158 De Garmo Ave, Sylmar, CA 91342 and is currently estimated at $721,766, approximately $611 per square foot. 13158 De Garmo Ave is a home located in Los Angeles County with nearby schools including Sylmar Elementary School, Olive Vista Middle School, and San Fernando Senior High School.
Ownership History
Date
Name
Owned For
Owner Type
Purchase Details
Closed on
Jan 13, 2025
Sold by
Espinoza Steve G
Bought by
Espinoza Steve G and Rodriguez Melania B
Current Estimated Value
Purchase Details
Closed on
Mar 7, 2018
Sold by
Espinoza Steve G
Bought by
Espinoza Steve G
Home Financials for this Owner
Home Financials are based on the most recent Mortgage that was taken out on this home.
Original Mortgage
$300,000
Interest Rate
4.44%
Mortgage Type
New Conventional
Create a Home Valuation Report for This Property
The Home Valuation Report is an in-depth analysis detailing your home's value as well as a comparison with similar homes in the area
Home Values in the Area
Average Home Value in this Area
Purchase History
| Date | Buyer | Sale Price | Title Company |
|---|---|---|---|
| Espinoza Steve G | -- | None Listed On Document | |
| Steve G Espinoza & Melania B Rodriguez Revoca | -- | None Listed On Document | |
| Espinoza Steve G | $130,000 | Tsi Title Company Of Califor |
Source: Public Records
Mortgage History
| Date | Status | Borrower | Loan Amount |
|---|---|---|---|
| Previous Owner | Espinoza Steve G | $300,000 |
Source: Public Records
Tax History Compared to Growth
Tax History
| Year | Tax Paid | Tax Assessment Tax Assessment Total Assessment is a certain percentage of the fair market value that is determined by local assessors to be the total taxable value of land and additions on the property. | Land | Improvement |
|---|---|---|---|---|
| 2025 | $3,732 | $294,332 | $117,728 | $176,604 |
| 2024 | $3,665 | $288,562 | $115,420 | $173,142 |
| 2023 | $3,597 | $282,905 | $113,157 | $169,748 |
| 2022 | $3,433 | $277,359 | $110,939 | $166,420 |
| 2021 | $3,387 | $271,921 | $108,764 | $163,157 |
| 2019 | $3,287 | $263,858 | $105,539 | $158,319 |
| 2018 | $3,223 | $258,685 | $103,470 | $155,215 |
| 2016 | $3,071 | $248,642 | $99,453 | $149,189 |
| 2015 | $3,027 | $244,909 | $97,960 | $146,949 |
| 2014 | $3,044 | $240,113 | $96,042 | $144,071 |
Source: Public Records
Map
Nearby Homes
- 14923 La Valle St
- 13009 Herrick Ave
- 14758 Lakeside St
- 15235 152351/2 Nurmi St
- 13007 Glenoaks Blvd
- 12867 Norris Ave
- 14594 Lyle St
- 14529 Paddock St
- 13108 Fellows Ave
- 14785 Polk St
- 12796 Norris Ave
- 13120 Bradley Ave Unit 43
- 13120 Bradley Ave Unit 44
- 13016 Jamie Ave
- 14401 Lakeside St
- 15185 Cobalt St
- 14840 Polk St
- 14523 Ryan St
- 13531 Fusano Ave
- 12642 Ralston Ave Unit 1
- 13152 De Garmo Ave
- 13166 De Garmo Ave
- 14822 Ryan St
- 14816 Ryan St
- 13171 De Haven Ave
- 13175 De Haven Ave
- 13140 De Garmo Ave
- 14749 Tyler St
- 14850 Ryan St
- 14812 Ryan St
- 14741 Tyler St
- 14806 Ryan St
- 13163 De Haven Ave
- 13176 De Haven Ave
- 14800 Ryan St
- 14821 Ryan St
- 14862 Ryan St
- 14750 Tyler St
- 14754 Tyler St
- 14766 Ryan St