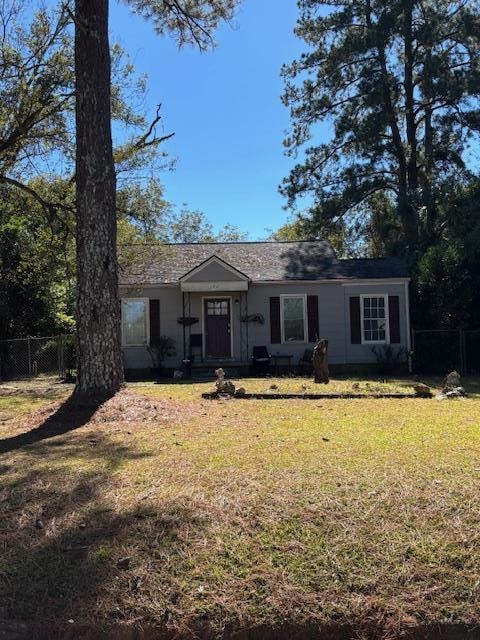
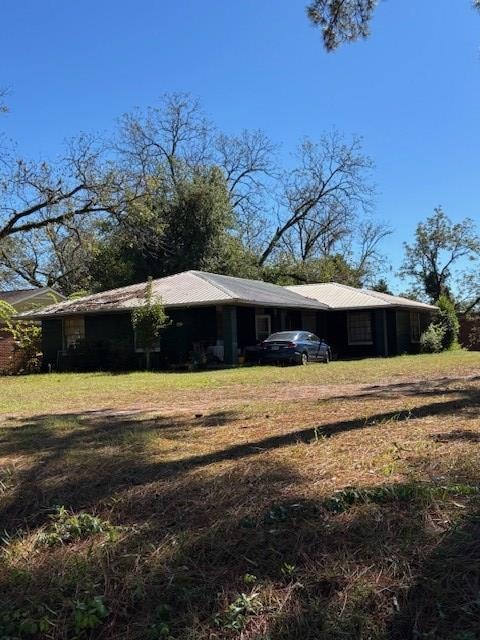
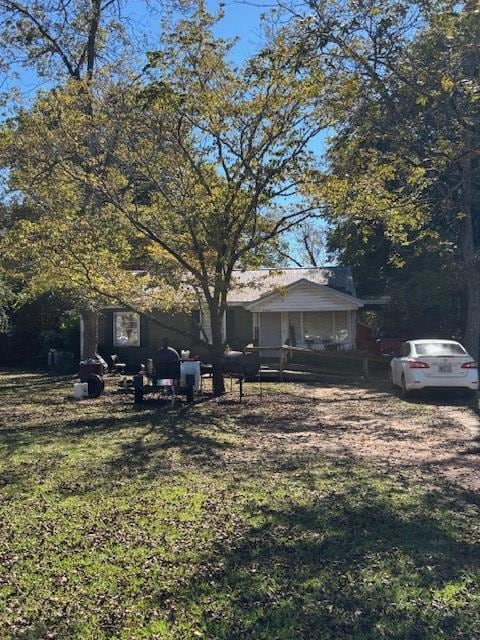
1316 11th Ave Albany, GA 31707
Palmyra Heights NeighborhoodEstimated payment $1,323/month
3
Beds
1
Bath
1,003
Sq Ft
$234
Price per Sq Ft
Highlights
- Waterfront
- Central Air
- 1-Story Property
- Wood Flooring
About This Home
Package deal 3 properties (duplex and 2 houses) for $235000.00. Great investment. Total income for all 3 houses is 2425.00 per month. This sale include 1108 W 4th duplex and 1916 W Broad.
Listing Agent
Southern Pines Realty, Inc Brokerage Phone: 2293955802 License #205282 Listed on: 10/21/2025
Home Details
Home Type
- Single Family
Est. Annual Taxes
- $1,017
Year Built
- Built in 1950
Lot Details
- 0.28 Acre Lot
- Waterfront
Home Design
- Frame Construction
- Shingle Roof
- Wood Trim
Interior Spaces
- 1,003 Sq Ft Home
- 1-Story Property
- Crawl Space
Flooring
- Wood
- Vinyl
Bedrooms and Bathrooms
- 3 Bedrooms
- 1 Full Bathroom
Parking
- Driveway
- Open Parking
Utilities
- Central Air
Community Details
- Metes And Bounds Subdivision
Listing and Financial Details
- Tax Lot 16
- Assessor Parcel Number 0000G/00006/020
Map
Create a Home Valuation Report for This Property
The Home Valuation Report is an in-depth analysis detailing your home's value as well as a comparison with similar homes in the area
Home Values in the Area
Average Home Value in this Area
Tax History
| Year | Tax Paid | Tax Assessment Tax Assessment Total Assessment is a certain percentage of the fair market value that is determined by local assessors to be the total taxable value of land and additions on the property. | Land | Improvement |
|---|---|---|---|---|
| 2024 | $1,017 | $21,320 | $6,360 | $14,960 |
| 2023 | $993 | $21,320 | $6,360 | $14,960 |
| 2022 | $997 | $21,320 | $6,360 | $14,960 |
| 2021 | $924 | $21,320 | $6,360 | $14,960 |
| 2020 | $926 | $21,320 | $6,360 | $14,960 |
| 2019 | $930 | $21,320 | $6,360 | $14,960 |
| 2018 | $934 | $21,320 | $6,360 | $14,960 |
| 2017 | $870 | $21,320 | $6,360 | $14,960 |
| 2016 | $727 | $21,320 | $6,360 | $14,960 |
| 2015 | $655 | $21,320 | $6,360 | $14,960 |
| 2014 | $925 | $22,880 | $7,920 | $14,960 |
Source: Public Records
Property History
| Date | Event | Price | List to Sale | Price per Sq Ft | Prior Sale |
|---|---|---|---|---|---|
| 10/27/2025 10/27/25 | Pending | -- | -- | -- | |
| 10/21/2025 10/21/25 | For Sale | $235,000 | +428.1% | $234 / Sq Ft | |
| 04/17/2015 04/17/15 | Sold | $44,500 | +11.3% | $44 / Sq Ft | View Prior Sale |
| 02/12/2015 02/12/15 | Pending | -- | -- | -- | |
| 06/13/2014 06/13/14 | Sold | $40,000 | -- | $40 / Sq Ft | View Prior Sale |
| 05/29/2014 05/29/14 | Pending | -- | -- | -- |
Source: Albany Board of REALTORS®
Purchase History
| Date | Type | Sale Price | Title Company |
|---|---|---|---|
| Quit Claim Deed | -- | -- | |
| Warranty Deed | $44,500 | -- | |
| Warranty Deed | $40,000 | -- | |
| Executors Deed | $32,000 | -- | |
| Quit Claim Deed | -- | -- | |
| Quit Claim Deed | -- | -- | |
| Deed | -- | -- |
Source: Public Records
Mortgage History
| Date | Status | Loan Amount | Loan Type |
|---|---|---|---|
| Previous Owner | $35,600 | New Conventional |
Source: Public Records
Source: Albany Board of REALTORS®
MLS Number: 166944
APN: 0000G-00006-020
Nearby Homes
- 1307 8th Ave
- 1502 Argonne Dr
- 1511 11th Ave
- 1200 13th Ave
- 1114 10th Ave
- 1113 11th Ave
- 1907 Edgewood Ln
- 1607 11th Ave
- 1907 Homewood Dr
- 1524 Argonne Dr
- 1403 Edgewood Ln
- 1306 Gary Ave
- 1302 Gary Ave
- 1112 Whispering Pines Rd
- 1307 Gary Ave
- 1207 Pinecrest Dr
- 1307 5th Ave
- 1505 5th Ave
- 1234 Hilltop Dr
- 1307 W 4th Ave
