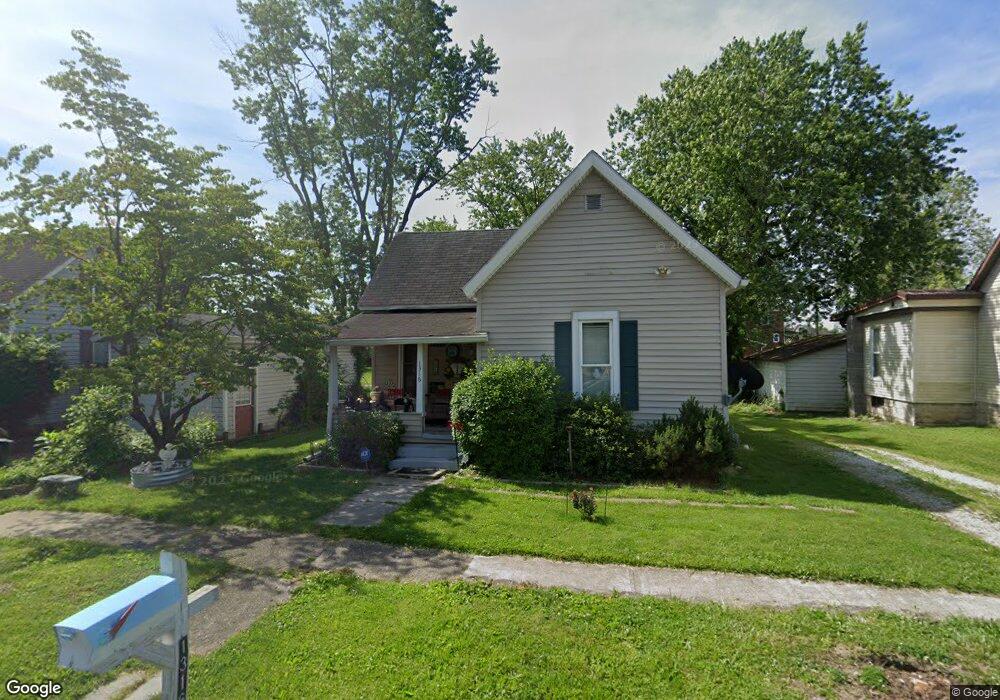
1316 18th St Bedford, IN 47421
Estimated Value: $83,000 - $143,000
2
Beds
1
Bath
1,242
Sq Ft
$102/Sq Ft
Est. Value
About This Home
This home is located at 1316 18th St, Bedford, IN 47421 and is currently estimated at $127,109, approximately $102 per square foot. 1316 18th St is a home located in Lawrence County with nearby schools including Bedford North Lawrence High School, St. Vincent de Paul School, and Stone City Christian Academy.
Ownership History
Date
Name
Owned For
Owner Type
Purchase Details
Closed on
Jul 21, 2021
Sold by
Dixon & Sons Properties
Bought by
Bultman Terry and Bultman Gwendolyn L
Current Estimated Value
Home Financials for this Owner
Home Financials are based on the most recent Mortgage that was taken out on this home.
Original Mortgage
$122,657
Outstanding Balance
$111,292
Interest Rate
2.9%
Mortgage Type
FHA
Estimated Equity
$15,817
Purchase Details
Closed on
Oct 14, 2019
Sold by
Dixon Christopher and Dixon Amy
Bought by
Dixon Properties Llc
Create a Home Valuation Report for This Property
The Home Valuation Report is an in-depth analysis detailing your home's value as well as a comparison with similar homes in the area
Home Values in the Area
Average Home Value in this Area
Purchase History
| Date | Buyer | Sale Price | Title Company |
|---|---|---|---|
| Bultman Terry | $119,900 | None Available | |
| Dixon Properties Llc | -- | -- |
Source: Public Records
Mortgage History
| Date | Status | Borrower | Loan Amount |
|---|---|---|---|
| Open | Bultman Terry | $122,657 |
Source: Public Records
Tax History Compared to Growth
Tax History
| Year | Tax Paid | Tax Assessment Tax Assessment Total Assessment is a certain percentage of the fair market value that is determined by local assessors to be the total taxable value of land and additions on the property. | Land | Improvement |
|---|---|---|---|---|
| 2024 | $456 | $91,400 | $9,100 | $82,300 |
| 2023 | $188 | $84,600 | $8,800 | $75,800 |
| 2022 | $188 | $78,300 | $8,600 | $69,700 |
| 2021 | $784 | $42,900 | $8,300 | $34,600 |
| 2020 | $784 | $39,200 | $8,000 | $31,200 |
| 2019 | $756 | $37,800 | $7,700 | $30,100 |
| 2018 | $736 | $36,800 | $7,600 | $29,200 |
| 2017 | $706 | $35,300 | $7,400 | $27,900 |
| 2016 | $696 | $34,800 | $7,100 | $27,700 |
| 2014 | $682 | $34,100 | $7,100 | $27,000 |
Source: Public Records
Map
Nearby Homes