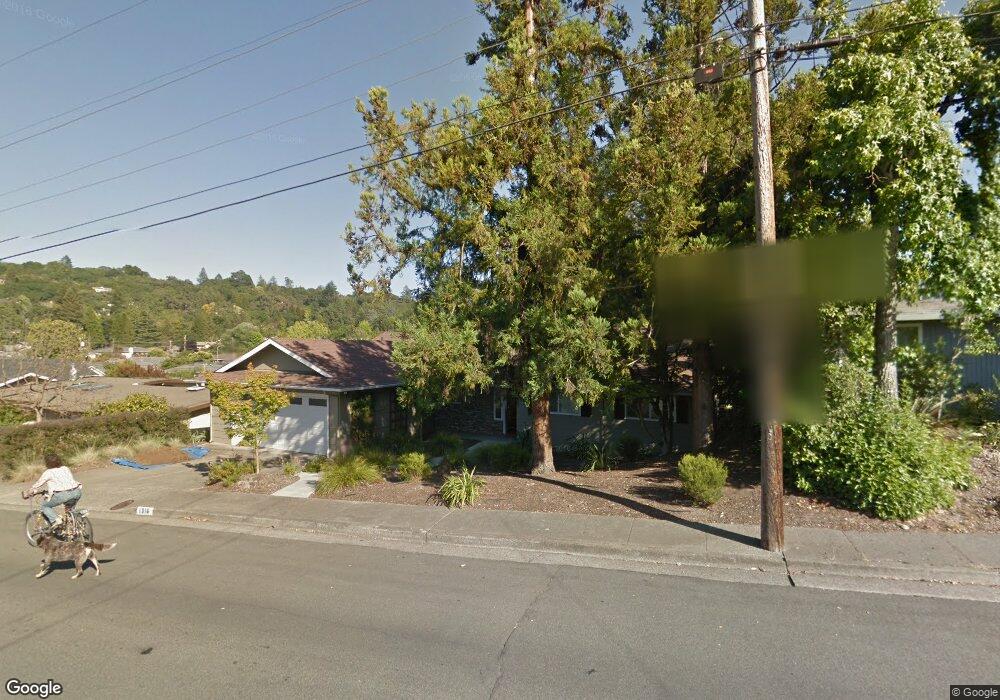
1316 Hexem Ave Santa Rosa, CA 95404
Estimated Value: $844,000 - $1,061,000
4
Beds
3
Baths
1,819
Sq Ft
$517/Sq Ft
Est. Value
About This Home
This home is located at 1316 Hexem Ave, Santa Rosa, CA 95404 and is currently estimated at $941,240, approximately $517 per square foot. 1316 Hexem Ave is a home located in Sonoma County with nearby schools including Hidden Valley Elementary School, Santa Rosa Middle School, and Santa Rosa High School.
Ownership History
Date
Name
Owned For
Owner Type
Purchase Details
Closed on
Feb 19, 2013
Sold by
Pink Viking Llc
Bought by
Miklos Andrew Z
Current Estimated Value
Home Financials for this Owner
Home Financials are based on the most recent Mortgage that was taken out on this home.
Original Mortgage
$417,000
Outstanding Balance
$290,561
Interest Rate
3.34%
Mortgage Type
New Conventional
Estimated Equity
$650,679
Purchase Details
Closed on
Aug 23, 2012
Sold by
Vey Charles D and The Charles D Vey Revocable Tr
Bought by
Pink Viking Llc
Home Financials for this Owner
Home Financials are based on the most recent Mortgage that was taken out on this home.
Original Mortgage
$750,000
Interest Rate
3.49%
Mortgage Type
Credit Line Revolving
Purchase Details
Closed on
Oct 3, 2001
Sold by
Vey Charles D
Bought by
Vey Charles D and Charles D Vey Revocable Trust
Create a Home Valuation Report for This Property
The Home Valuation Report is an in-depth analysis detailing your home's value as well as a comparison with similar homes in the area
Purchase History
| Date | Buyer | Sale Price | Title Company |
|---|---|---|---|
| Miklos Andrew Z | $535,000 | First American Title Company | |
| Pink Viking Llc | $342,500 | First American Title Company | |
| Vey Charles D | -- | -- |
Source: Public Records
Mortgage History
| Date | Status | Borrower | Loan Amount |
|---|---|---|---|
| Open | Miklos Andrew Z | $417,000 | |
| Previous Owner | Pink Viking Llc | $750,000 |
Source: Public Records
Tax History
| Year | Tax Paid | Tax Assessment Tax Assessment Total Assessment is a certain percentage of the fair market value that is determined by local assessors to be the total taxable value of land and additions on the property. | Land | Improvement |
|---|---|---|---|---|
| 2025 | $7,435 | $658,803 | $263,521 | $395,282 |
| 2024 | $7,435 | $645,886 | $258,354 | $387,532 |
| 2023 | $7,435 | $633,223 | $253,289 | $379,934 |
| 2022 | $6,866 | $620,808 | $248,323 | $372,485 |
| 2021 | $6,784 | $608,636 | $243,454 | $365,182 |
| 2020 | $6,768 | $602,396 | $240,958 | $361,438 |
| 2019 | $6,733 | $590,585 | $236,234 | $354,351 |
| 2018 | $6,697 | $579,005 | $231,602 | $347,403 |
| 2017 | $6,577 | $567,653 | $227,061 | $340,592 |
| 2016 | $6,534 | $556,523 | $222,609 | $333,914 |
| 2015 | $6,337 | $548,165 | $219,266 | $328,899 |
| 2014 | $5,949 | $537,428 | $214,971 | $322,457 |
Source: Public Records
Map
Nearby Homes
- 2126 Northwood Dr
- 2625 Hidden Valley Dr
- 1136 Poppy Dr
- 1829 Wright St
- 3460 Happy Valley Ave
- 2149 Humboldt St
- 689 Plum Dr
- 1644 Julianne Place
- 1320 North St Unit 7
- 3779 Nielsen Rd
- 1055 Wright St
- 1944 Grosse Ave
- 1404 Slater St
- 1362 Manzanita Ct
- 1016 Spring St
- 1102 North St
- 2034 Augustan Ave
- 3348 Terra Linda Dr
- 2656 Knob Hill Dr
- 915 Saint Helena Ave
- 1310 Hexem Ave
- 1420 Hexem Ave
- 129 Northwood Ct
- 1315 Hexem Ave
- 1304 Hexem Ave
- 1424 Hexem Ave
- 1303 Hexem Ave
- 122 Northwood Ct
- 2020 Woodside Dr
- 1226 Hexem Ave
- 2025 Woodside Dr
- 2026 Cummings Dr
- 2123 Northwood Dr
- 133 Northwood Ct
- 121 Hollow Tree Ct
- 2024 Woodside Dr
- 2211 Northwood Dr
- 125 Hollow Tree Ct
- 118 Northwood Ct
- 1218 Hexem Ave
Your Personal Tour Guide
Ask me questions while you tour the home.