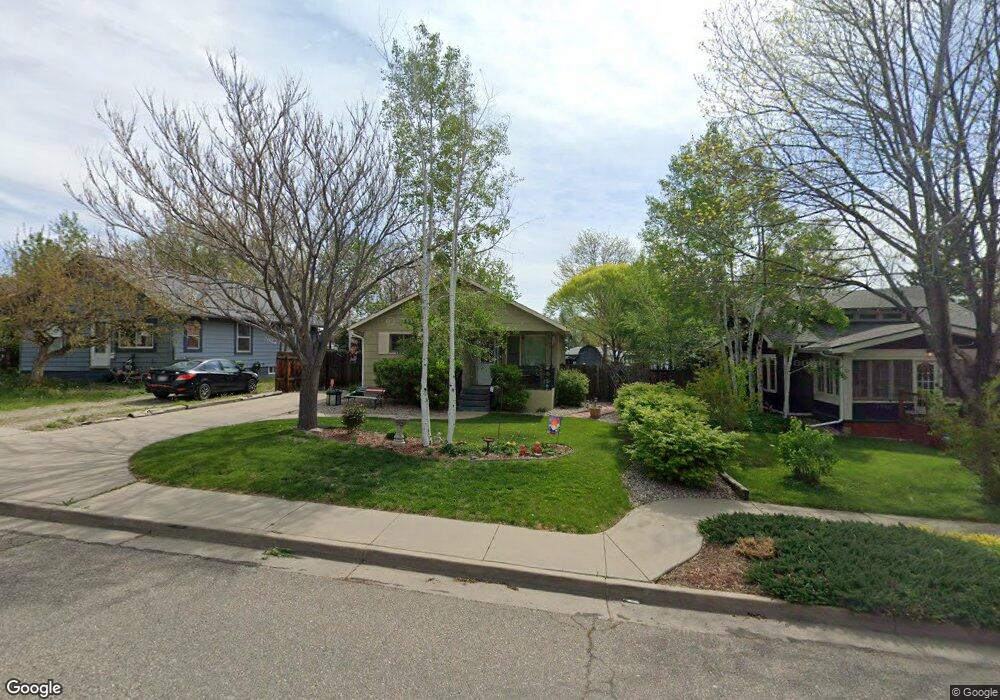
1316 N Jefferson Ave Loveland, CO 80537
Estimated Value: $419,747 - $431,000
3
Beds
2
Baths
1,518
Sq Ft
$279/Sq Ft
Est. Value
About This Home
This home is located at 1316 N Jefferson Ave, Loveland, CO 80537 and is currently estimated at $423,687, approximately $279 per square foot. 1316 N Jefferson Ave is a home located in Larimer County with nearby schools including Truscott Elementary School, Bill Reed Middle School, and Loveland High School.
Ownership History
Date
Name
Owned For
Owner Type
Purchase Details
Closed on
Apr 29, 2005
Sold by
Bonetti Ken
Bought by
Reents Shaun and Miera Reents Victoria
Current Estimated Value
Home Financials for this Owner
Home Financials are based on the most recent Mortgage that was taken out on this home.
Original Mortgage
$139,920
Outstanding Balance
$74,728
Interest Rate
6.22%
Mortgage Type
Fannie Mae Freddie Mac
Estimated Equity
$348,959
Purchase Details
Closed on
Jan 13, 2003
Sold by
Lundberg Laura
Bought by
Bonetti Ken
Purchase Details
Closed on
Sep 29, 2000
Sold by
Bega Sherry K
Bought by
Lundberg Laura and Bonetti Ken
Home Financials for this Owner
Home Financials are based on the most recent Mortgage that was taken out on this home.
Original Mortgage
$111,920
Interest Rate
7.97%
Purchase Details
Closed on
Jun 30, 2000
Sold by
Bega Abel A
Bought by
Bega Sherry K
Purchase Details
Closed on
Oct 1, 1993
Sold by
Hergenreder Robert H
Bought by
Bega Abel A
Create a Home Valuation Report for This Property
The Home Valuation Report is an in-depth analysis detailing your home's value as well as a comparison with similar homes in the area
Home Values in the Area
Average Home Value in this Area
Purchase History
| Date | Buyer | Sale Price | Title Company |
|---|---|---|---|
| Reents Shaun | $174,900 | -- | |
| Bonetti Ken | -- | -- | |
| Lundberg Laura | $139,900 | Larimer County Title Co Llc | |
| Bega Sherry K | -- | -- | |
| Bega Abel A | $70,000 | -- |
Source: Public Records
Mortgage History
| Date | Status | Borrower | Loan Amount |
|---|---|---|---|
| Open | Reents Shaun | $139,920 | |
| Previous Owner | Lundberg Laura | $111,920 | |
| Closed | Reents Shaun | $34,980 |
Source: Public Records
Tax History Compared to Growth
Tax History
| Year | Tax Paid | Tax Assessment Tax Assessment Total Assessment is a certain percentage of the fair market value that is determined by local assessors to be the total taxable value of land and additions on the property. | Land | Improvement |
|---|---|---|---|---|
| 2025 | $2,086 | $29,828 | $2,144 | $27,684 |
| 2024 | $2,012 | $29,828 | $2,144 | $27,684 |
| 2022 | $1,719 | $21,601 | $2,224 | $19,377 |
| 2021 | $1,766 | $22,222 | $2,288 | $19,934 |
| 2020 | $1,775 | $22,322 | $2,288 | $20,034 |
| 2019 | $1,745 | $22,322 | $2,288 | $20,034 |
| 2018 | $1,465 | $17,798 | $2,304 | $15,494 |
| 2017 | $1,261 | $17,798 | $2,304 | $15,494 |
| 2016 | $1,222 | $16,660 | $2,547 | $14,113 |
| 2015 | $1,212 | $16,660 | $2,550 | $14,110 |
| 2014 | $1,142 | $15,190 | $2,550 | $12,640 |
Source: Public Records
Map
Nearby Homes
- 1312 N Washington Ave
- 526 E 13th St
- 1204 N Lincoln Ave
- 1550 N Jefferson Ave
- 0 W Eisenhower Blvd
- 1117 Cleveland Ave
- 103 E 12th St
- 1031 N Lincoln Ave
- 125 E 15th St
- 1336 Arthur Ave
- 1512 Jackson Ave
- 411 E 10th St
- 1534 Jackson Ave
- 1034 N Cleveland Ave
- 1612 N Cleveland Ave
- 770 N Lincoln Ave
- 1618 Pinyon Ct
- 1700 N Garfield Ave
- 717 E 8th St
- 707 E 8th St
- 1308 N Jefferson Ave
- 1320 N Jefferson Ave
- 403 E 13th St
- 1328 N Jefferson Ave
- 1330 N Jefferson Ave
- 1305 Washington Ave
- 1319 Washington Ave
- 1329 Washington Ave
- 1301 Washington Ave
- 1303 N Jefferson Ave
- 1236 N Jefferson Ave
- 422 E 13th St
- 1332 N Jefferson Ave
- 1325 N Jefferson Ave
- 1307 N Jefferson Ave
- 1335 N Jefferson Ave
- 1345 N Jefferson Ave
- 450 E 13th St
- 440 E 13th St
- 375 E 13th St