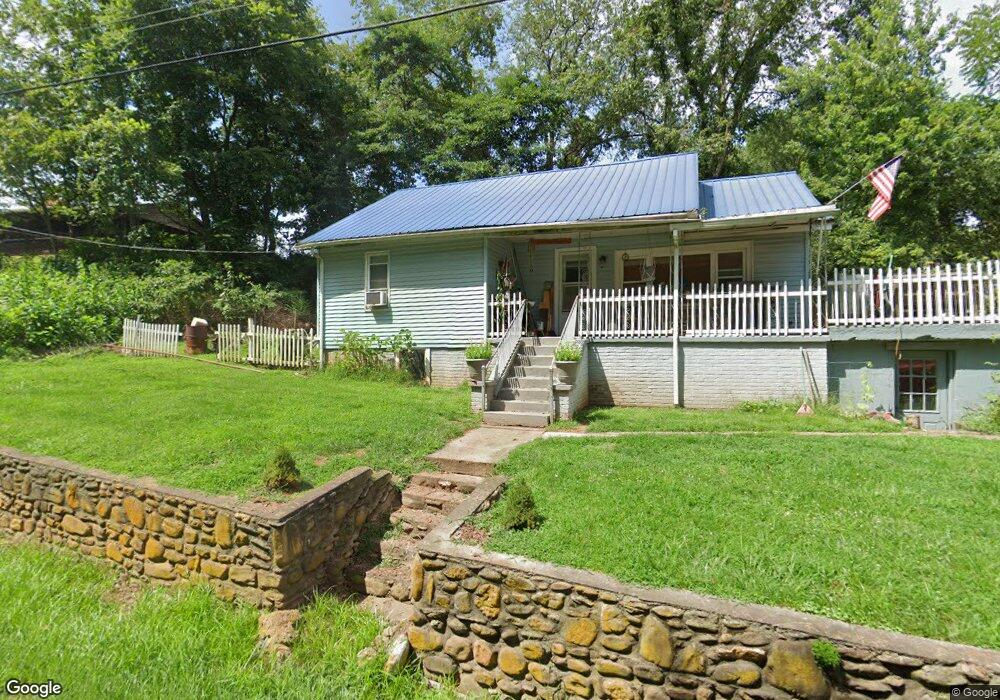
1316 Phillipsville Loop Canton, NC 28716
Estimated Value: $146,000 - $410,000
2
Beds
1
Bath
1,824
Sq Ft
$134/Sq Ft
Est. Value
About This Home
This home is located at 1316 Phillipsville Loop, Canton, NC 28716 and is currently estimated at $243,864, approximately $133 per square foot. 1316 Phillipsville Loop is a home located in Haywood County with nearby schools including North Canton Elementary School, Canton Middle, and Pisgah High School.
Ownership History
Date
Name
Owned For
Owner Type
Purchase Details
Closed on
Oct 11, 2011
Sold by
Chapman Kimberly Renee
Bought by
Chapman John
Current Estimated Value
Purchase Details
Closed on
Jun 6, 2011
Sold by
Taylor Tracy and Taylor Beulah
Bought by
Wells Fargo Bank N A
Purchase Details
Closed on
Jun 16, 2006
Sold by
Conard Harriet and Conard Gary
Bought by
Taylor Tracy Lynn and Taylor Beulah Faye
Home Financials for this Owner
Home Financials are based on the most recent Mortgage that was taken out on this home.
Original Mortgage
$25,001
Interest Rate
6.55%
Mortgage Type
Stand Alone Second
Purchase Details
Closed on
Aug 29, 2005
Sold by
Mortgage Electronic Registration Systems
Bought by
Conard Harriet and Conard Gary
Purchase Details
Closed on
Jan 18, 2005
Sold by
Snyder William Doyle and Snyder Beverly B
Bought by
Equity One Inc
Create a Home Valuation Report for This Property
The Home Valuation Report is an in-depth analysis detailing your home's value as well as a comparison with similar homes in the area
Home Values in the Area
Average Home Value in this Area
Purchase History
| Date | Buyer | Sale Price | Title Company |
|---|---|---|---|
| Chapman John | -- | None Available | |
| Chapman Kimberly Renee | $17,500 | None Available | |
| Wells Fargo Bank N A | $27,500 | None Available | |
| Taylor Tracy Lynn | $90,000 | None Available | |
| Conard Harriet | $55,500 | None Available | |
| Equity One Inc | $50,500 | None Available |
Source: Public Records
Mortgage History
| Date | Status | Borrower | Loan Amount |
|---|---|---|---|
| Previous Owner | Taylor Tracy Lynn | $25,001 | |
| Previous Owner | Taylor Tracy Lynn | $64,899 |
Source: Public Records
Tax History
| Year | Tax Paid | Tax Assessment Tax Assessment Total Assessment is a certain percentage of the fair market value that is determined by local assessors to be the total taxable value of land and additions on the property. | Land | Improvement |
|---|---|---|---|---|
| 2025 | -- | $99,400 | $18,800 | $80,600 |
| 2024 | $8 | $99,400 | $18,800 | $80,600 |
| 2023 | $805 | $99,400 | $18,800 | $80,600 |
| 2022 | $790 | $99,400 | $18,800 | $80,600 |
| 2021 | $790 | $99,400 | $18,800 | $80,600 |
| 2020 | $586 | $62,400 | $14,100 | $48,300 |
| 2019 | $591 | $62,400 | $14,100 | $48,300 |
| 2018 | $591 | $62,400 | $14,100 | $48,300 |
| 2017 | $591 | $62,400 | $0 | $0 |
| 2016 | $585 | $63,200 | $0 | $0 |
| 2015 | $585 | $63,200 | $0 | $0 |
| 2014 | $497 | $63,200 | $0 | $0 |
Source: Public Records
Map
Nearby Homes
- 54 School House Dr
- 21 Lisa Dr
- 19 Mingus St
- 177 Dewey Ave
- 99999 Old Clyde Rd
- 157 Morgan St
- 36 Harkins Ave
- 195 Terrace Dr
- TBD England Dr
- 415 Pigeon Ford Rd
- 99999 Carolina Blvd
- 00 Bob Wood Dr
- 121 James St
- 0 Midway Crossing Dr Unit 15 CAR3931415
- 84 Madelyn Dr
- 21 Riverbend Rd
- 130 Midway Crossing Dr
- 61 Riverbend Rd
- 212 Callie River Ct
- 23 Callie River Ct
- 6704 Old Clyde Rd
- 1301 Phillipsville Loop
- 1289 Phillipsville Loop
- 1265 Phillipsville Loop
- 75 Lowe St
- 6722 Old Clyde Rd
- 63 Phillipsville Loop
- 20 Mingus Hill Rd
- 33 Haley St
- 22 Phillipsville Loop
- 6738 Old Clyde Rd
- 93 Phillipsville Loop
- 58 Phillipsville Loop
- - Mingus Hill Rd
- 62 Phillipsville Loop
- 87 Lowe St
- 984 Terrace Dr
- 1229 Phillipsville Loop
- 84 Phillipsville Loop
- 112 Mingus Hill Rd
Your Personal Tour Guide
Ask me questions while you tour the home.