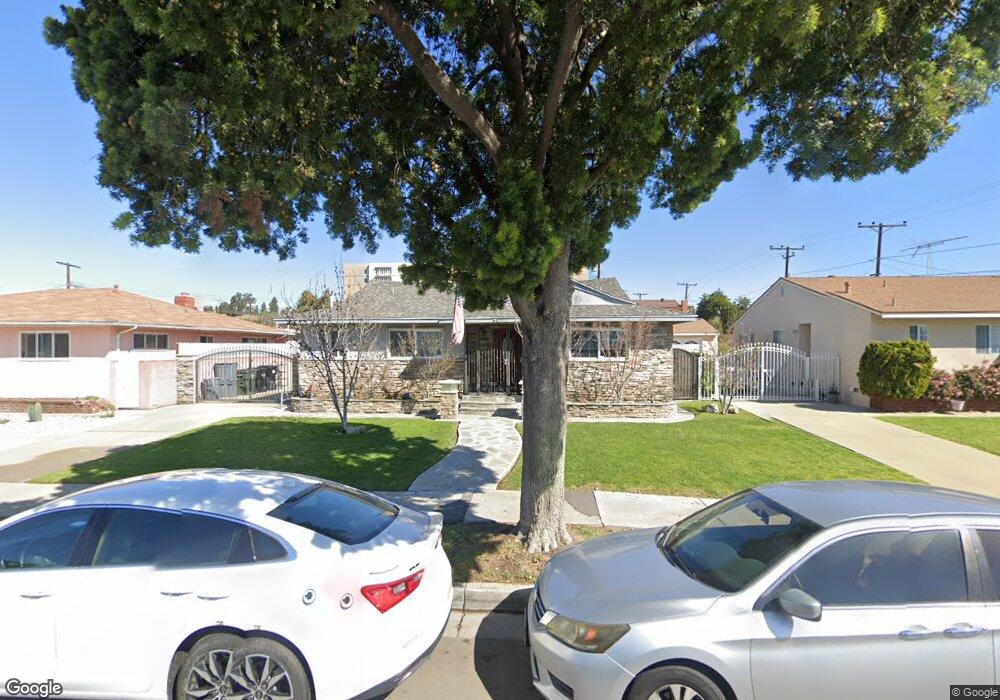
1316 W Harding Ave Montebello, CA 90640
Estimated Value: $840,000 - $897,000
3
Beds
2
Baths
1,830
Sq Ft
$476/Sq Ft
Est. Value
About This Home
This home is located at 1316 W Harding Ave, Montebello, CA 90640 and is currently estimated at $870,925, approximately $475 per square foot. 1316 W Harding Ave is a home located in Los Angeles County with nearby schools including Washington Elementary School, Montebello Intermediate School, and Montebello High School.
Ownership History
Date
Name
Owned For
Owner Type
Purchase Details
Closed on
Nov 13, 2020
Sold by
Amloyan Thomas T and Amloyan Thomas
Bought by
Amloyan Thomas T and Amloyan Diana
Current Estimated Value
Home Financials for this Owner
Home Financials are based on the most recent Mortgage that was taken out on this home.
Original Mortgage
$241,000
Outstanding Balance
$174,076
Interest Rate
2.8%
Mortgage Type
New Conventional
Estimated Equity
$696,849
Purchase Details
Closed on
May 4, 2009
Sold by
Amloyan Diana
Bought by
Amloyan Thomas
Home Financials for this Owner
Home Financials are based on the most recent Mortgage that was taken out on this home.
Original Mortgage
$313,500
Interest Rate
4.78%
Mortgage Type
New Conventional
Purchase Details
Closed on
Jun 23, 1997
Sold by
Jimenez Rosendo
Bought by
Amloyan Thomas
Home Financials for this Owner
Home Financials are based on the most recent Mortgage that was taken out on this home.
Original Mortgage
$183,090
Interest Rate
7.58%
Mortgage Type
VA
Create a Home Valuation Report for This Property
The Home Valuation Report is an in-depth analysis detailing your home's value as well as a comparison with similar homes in the area
Home Values in the Area
Average Home Value in this Area
Purchase History
| Date | Buyer | Sale Price | Title Company |
|---|---|---|---|
| Amloyan Thomas T | -- | Stewart Title Of Ca Inc | |
| Amloyan Thomas | -- | Investors Title Company | |
| Amloyan Thomas | $179,500 | Investors Title Company |
Source: Public Records
Mortgage History
| Date | Status | Borrower | Loan Amount |
|---|---|---|---|
| Open | Amloyan Thomas T | $241,000 | |
| Closed | Amloyan Thomas | $313,500 | |
| Closed | Amloyan Thomas | $183,090 |
Source: Public Records
Tax History Compared to Growth
Tax History
| Year | Tax Paid | Tax Assessment Tax Assessment Total Assessment is a certain percentage of the fair market value that is determined by local assessors to be the total taxable value of land and additions on the property. | Land | Improvement |
|---|---|---|---|---|
| 2025 | $5,285 | $337,222 | $151,199 | $186,023 |
| 2024 | $5,285 | $330,611 | $148,235 | $182,376 |
| 2023 | $5,263 | $324,129 | $145,329 | $178,800 |
| 2022 | $5,088 | $317,775 | $142,480 | $175,295 |
| 2021 | $4,903 | $311,545 | $139,687 | $171,858 |
| 2020 | $4,819 | $308,351 | $138,255 | $170,096 |
| 2019 | $4,684 | $302,306 | $135,545 | $166,761 |
| 2018 | $4,656 | $296,380 | $132,888 | $163,492 |
| 2016 | $4,451 | $284,874 | $127,729 | $157,145 |
| 2015 | $4,222 | $280,596 | $125,811 | $154,785 |
| 2014 | $4,169 | $275,100 | $123,347 | $151,753 |
Source: Public Records
Map
Nearby Homes
- 1516 W Beverly Terrace
- 504 Jay Ct
- 410 N 18th St
- 813 W Beverly Terrace
- 605 N 18th St
- 320 N Montebello Blvd
- 538 N 20th St
- 701 W Madison Ave
- 1917 Merle Dr
- 219 S Greenwood Ave
- 416 W Cleveland Ave
- 324 Morris Place
- 2225 W Beverly Blvd
- 2229 W Beverly Blvd
- 525 N 3rd St
- 995 Walnut Terrace
- 1015 Walnut Terrace
- 1025 Walnut Terrace
- 955 Walnut Terrace
- 935 Walnut Terrace
- 1320 W Harding Ave
- 1312 W Harding Ave
- 1317 W Beverly Terrace
- 1400 W Harding Ave
- 1311 W Beverly Terrace
- 1321 W Beverly Terrace
- 405 N Taylor Ave
- 401 N Taylor Ave
- 409 N Taylor Ave
- 1404 W Harding Ave
- 413 N Taylor Ave
- 417 N Taylor Ave
- 339 N Taylor Ave
- 1407 W Beverly Terrace
- 421 N Taylor Ave
- 335 N Taylor Ave
- 425 N Taylor Ave
- 331 N Taylor Ave
- 405 N Park Ave
- 401 N Park Ave