Estimated Value: $847,823 - $932,000
4
Beds
3
Baths
2,424
Sq Ft
$370/Sq Ft
Est. Value
About This Home
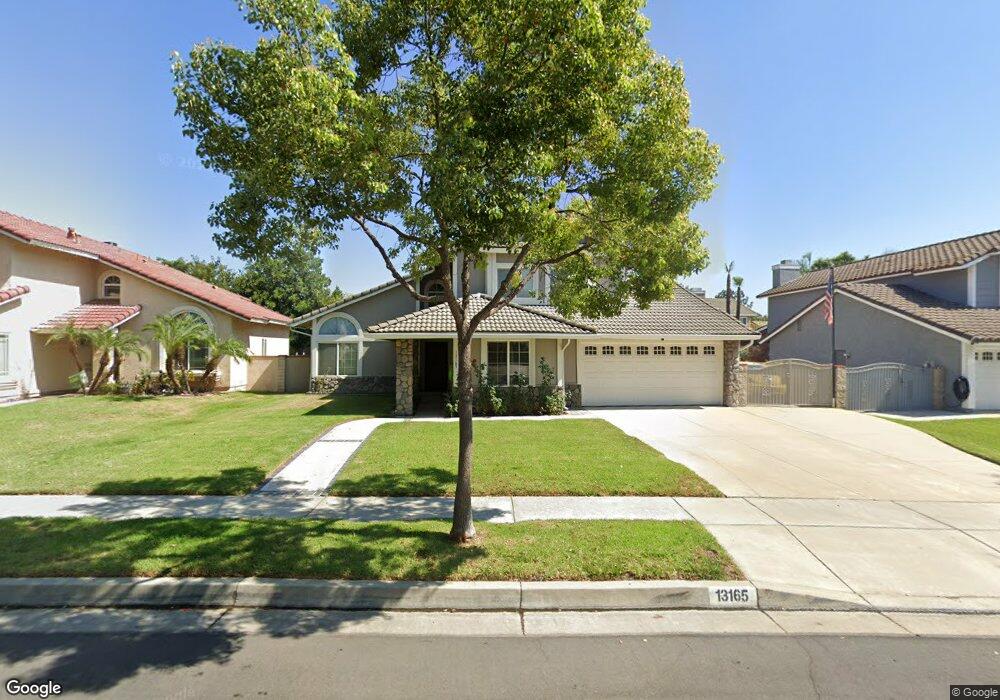
This home is located at 13165 Orange Ct, Chino, CA 91710 and is currently estimated at $895,956, approximately $369 per square foot. 13165 Orange Ct is a home located in San Bernardino County with nearby schools including Howard Cattle Elementary, Magnolia Junior High, and Chino High School.
Ownership History
Date
Name
Owned For
Owner Type
Purchase Details
Closed on
Aug 26, 2003
Sold by
Strub Richard R and Strub Carmela J
Bought by
Strub Richard R and Strub Carmela J
Current Estimated Value
Purchase Details
Closed on
Mar 14, 2000
Sold by
Bodin William L and Bodin Ana R
Bought by
Strub Richard R and Strub Carmela J
Home Financials for this Owner
Home Financials are based on the most recent Mortgage that was taken out on this home.
Original Mortgage
$168,000
Outstanding Balance
$56,978
Interest Rate
8.3%
Estimated Equity
$838,978
Purchase Details
Closed on
Apr 1, 1996
Sold by
Federal Home Loan Mortgage Corporation
Bought by
Bodin William L and Bodin Ana R
Home Financials for this Owner
Home Financials are based on the most recent Mortgage that was taken out on this home.
Original Mortgage
$156,500
Interest Rate
7.68%
Purchase Details
Closed on
Dec 29, 1995
Sold by
Antimo Javier and Antimo Barbara
Bought by
Federal Home Loan Mortgage Corporation
Create a Home Valuation Report for This Property
The Home Valuation Report is an in-depth analysis detailing your home's value as well as a comparison with similar homes in the area
Home Values in the Area
Average Home Value in this Area
Purchase History
We collect this data history from publicly available records. To have your information removed, we recommend requesting removal directly through your county’s website.
| Date | Buyer | Sale Price | Title Company |
|---|---|---|---|
| Strub Richard R | -- | -- | |
| Strub Richard R | $210,000 | Chicago Title Co | |
| Bodin William L | $174,000 | Commonwealth Land Title Co | |
| Federal Home Loan Mortgage Corporation | $179,350 | Northern Counties Title Ins |
Source: Public Records
Mortgage History
We collect this data history from publicly available records. To have your information removed, we recommend requesting removal directly through your county’s website.
| Date | Status | Borrower | Loan Amount |
|---|---|---|---|
| Open | Strub Richard R | $168,000 | |
| Previous Owner | Bodin William L | $156,500 |
Source: Public Records
Tax History
| Year | Tax Paid | Tax Assessment Tax Assessment Total Assessment is a certain percentage of the fair market value that is determined by local assessors to be the total taxable value of land and additions on the property. | Land | Improvement |
|---|---|---|---|---|
| 2025 | $3,708 | $322,762 | $112,966 | $209,796 |
| 2024 | $3,613 | $316,433 | $110,751 | $205,682 |
| 2023 | $3,517 | $310,228 | $108,579 | $201,649 |
| 2022 | $3,495 | $304,145 | $106,450 | $197,695 |
| 2021 | $3,429 | $298,182 | $104,363 | $193,819 |
| 2020 | $3,386 | $295,125 | $103,293 | $191,832 |
| 2019 | $3,329 | $289,339 | $101,268 | $188,071 |
| 2018 | $3,258 | $283,665 | $99,282 | $184,383 |
| 2017 | $3,202 | $278,103 | $97,335 | $180,768 |
| 2016 | $3,002 | $272,650 | $95,426 | $177,224 |
| 2015 | $2,945 | $268,555 | $93,993 | $174,562 |
| 2014 | $2,889 | $263,295 | $92,152 | $171,143 |
Source: Public Records
Map
Nearby Homes
- 13150 Robin Ct
- 12997 Falcon Place
- 13035 Arlington Ln
- 14000 San Antonio Ave
- 13401 Hammer Ave
- 6833 Renato Ct
- 13131 Melon Ave
- 6590 Mogano Dr
- 6850 Meadowlark Ln
- 6963 Montego St
- 13469 Saratoga Place
- 13227 Lamar Ave
- 6783 Bradford Ct
- 13218 Stellar Ave
- 6776 Bradford Ct
- 6755 Foxcroft Ct
- 13055 Waterlily Way
- 13027 Bermuda Ave
- 13431 Goldmedal Ave
- 6351 Riverside Dr Unit 69
- 13155 Orange Ct
- 13175 Orange Ct
- 13166 Chukar Ct
- 13176 Chukar Ct
- 13156 Chukar Ct
- 13145 Orange Ct
- 13185 Orange Ct
- 13164 Orange Ct
- 13174 Orange Ct
- 13146 Chukar Ct
- 13186 Chukar Ct
- 13154 Orange Ct
- 13135 Orange Ct
- 13184 Orange Ct
- 13144 Orange Ct
- 13136 Chukar Ct
- 13134 Orange Ct
- 13194 Orange Ct
- 13161 Robin Ct
- 13167 Chukar Ct
Your Personal Tour Guide
Ask me questions while you tour the home.